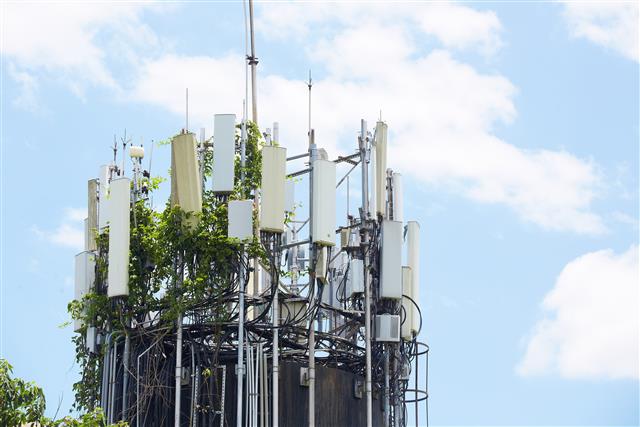
- Iteq
-
PerformanceThe company's stock price closed at NT$64.5 on the TSE on Thursday, August 11, 2022.The company has reported consolidated revenues of NT$2,203 million for July 2022, representing a 13% drop on month and 25.4% drop on year.For the first quarter of 2022, the company totaled NT$8,269 million in consolidated revenues, up 3% sequentially and up 11.8% on year.Brief
Full name: Iteq
Chinese name: 聯茂電子股份有限公司
Short name: Iteq
Stock code: 6213
Tax ID: 97179403
Market: TSE
Established: 10 Apr 1997
Paid in capital: NT$3.03 billion
Listed on OTC: 30 Dec 2002
Listed on ESB: 23 May 2002
Public since: 14 Oct 1997
Website: www.iteq.com.tw
-
On display
Iteq secures distribution orders from Laird for thermally conductive materials
Iteq and Laird Technologies officially signed a distribution contract...
Photo: Andrea Liu, Aug 20.
-
Latest stock
Iteq [6213] historical stock price (NT$) Date Volume (k) Transactions Value Open High Low Close Change Ask Bid 12-Aug 1,392 1,253 90,672,532 64.50 66.10 64.10 66.10 +1.60 +2.48% 66.00 66.10 11-Aug 1,213 1,153 78,755,727 65.60 65.60 64.40 64.50 +0.10 +0.16% 64.50 64.60 10-Aug 1,170 1,139 74,831,668 62.60 64.70 62.60 64.40 +0.70 +1.10% 64.30 64.50 9-Aug 2,111 1,662 133,007,716 61.50 64.20 61.00 63.70 +2.00 +3.24% 63.70 63.80 8-Aug 1,819 1,345 110,619,641 60.20 61.90 59.70 61.70 +0.30 +0.49% 61.60 61.70 5-Aug 2,914 2,256 179,840,893 62.00 62.70 61.10 61.40 +0.00 +0.00% 61.30 61.40 4-Aug 4,315 3,391 268,570,117 63.80 64.90 60.80 61.40 -3.50 -5.39% 61.30 61.40 - Source: TSE, compiled by Digitimes
Latest salesIteq: Consolidated revenues, Jul 2021 - Jul 2022 (NT$m)
Month
Sales
M/M
Y/Y
YTD
Y/Y
Jul-22
2,203
(13%)
(25.4%)
18,121
(2.1%)
Jun-22
2,531
3.3%
(9.6%)
15,918
2.4%
May-22
2,451
(8%)
(8.2%)
13,386
5%
Apr-22
2,665
(3.3%)
(0.9%)
10,935
8.5%
Mar-22
2,757
14.1%
0.2%
8,270
11.9%
Feb-22
2,416
(22%)
12.3%
5,513
18.8%
Jan-22
3,097
12.5%
24.3%
3,097
24.3%
Dec-21
2,752
6.1%
30%
32,517
27.9%
Nov-21
2,595
(3.1%)
28%
29,765
27.7%
Oct-21
2,678
(5.1%)
36.2%
27,170
27.7%
Sep-21
2,821
(10.9%)
32.9%
24,492
26.9%
Aug-21
3,167
7.3%
60.6%
21,671
26.1%
Jul-21
2,952
5.5%
39.3%
18,504
21.6%
*Figures are consolidated
Source: TSE, compiled by DIGITIMES Asia, August 2022Iteq: Consolidated revenues, 1Q21 - 1Q22 (NT$m)
Quarter
Sales
Q/Q
Y/Y
YTD
Y/Y
1Q-22
8,269
3%
11.8%
8,269
11.8%
4Q-21
8,031
(10.1%)
31.4%
32,525
27.9%
3Q-21
8,930
9.3%
43.6%
24,494
26.8%
2Q-21
8,168
10.4%
9.3%
15,564
18.9%
1Q-21
7,397
21%
31.7%
7,397
31.7%
*Figures are consolidated
Source: TSE, compiled by DIGITIMES Asia, August 2022Latest balance sheet and income statementIteq: Consolidated balance sheet, 1Q21 - 1Q22 (NT$k)
Item
1Q-2022
4Q-2021
3Q-2021
2Q-2021
1Q-2021
Current assets
24,797,178
24,375,369
25,131,170
22,312,483
20,036,486
Intangible assets
8,617
8,360
8,242
8,297
8,698
Non-current assets
10,816,735
11,861,917
10,904,085
10,385,697
9,313,412
Assets
35,613,913
36,237,286
36,035,255
32,698,180
29,349,898
Current liabilities
14,158,527
14,264,805
15,040,274
15,823,460
13,066,567
Non-current liabilities
671,531
657,743
640,519
2,136,775
2,311,812
Liabilities
14,830,058
14,922,548
15,680,793
17,960,235
15,378,379
Stockholders' equity
20,783,855
21,314,738
20,354,462
14,737,945
13,971,519
*Figures are consolidated
Source: TSE, compiled by DIGITIMES Asia, August 2022Iteq: Consolidated income statement, 1Q21 - 1Q22 (NT$k)
Item
1Q-2022
4Q-2021
3Q-2021
2Q-2021
1Q-2021
NT$k
% of sales
NT$k
% of sales
NT$k
% of sales
NT$k
% of sales
NT$k
% of sales
Operating revenue
8,269,058
8,030,798
8,929,775
8,167,579
7,396,536
Gross profit (loss) from operations
1,248,703
15.1%
1,246,254
15.5%
1,737,811
19.5%
1,625,430
19.9%
1,370,054
18.5%
Operating expenses
604,782
7.3%
542,954
6.8%
630,563
7.1%
483,449
5.9%
503,087
6.8%
Operating income (loss)
643,921
7.8%
703,300
8.8%
1,107,248
12.4%
1,141,981
14%
866,967
11.7%
Non-operating expenses and losses
332,081
4%
49,279
0.6%
-10,620
-0.1%
-19,462
-0.2%
-23,990
-0.3%
Income from continuing operations before income tax
976,002
11.8%
752,579
9.4%
1,096,628
12.3%
1,122,519
13.7%
842,977
11.4%
Net income (loss)
809,113
9.8%
807,121
10.1%
835,187
9.4%
859,954
10.5%
642,541
8.7%
Diluted earnings per share (NT$)
2.1
2.1
2.4
2.6
1.9
*Figures are consolidated
Source: TSE, compiled by DIGITIMES Asia, August 2022 - Iteq full profile