
In addition to strong potential video content demand in China, the market has developed rapidly due to government intervention and delays in establishing copyright protections. Content is delivered via traditional broadcasting firms, as well as through the dramatic rise of Internet firms and TV vendors delivering content through connected and smart TVs. There are currently 400 million TVs in use, and each year sales of TVs in China exceed 40 million.
Chart 7: Digital switchover share for cable TV, by provincial-level region, 2011 (%)
Chart 8: Growth in China terrestrial analog and digital TV viewer numbers, 2011-2016 (k households)
Chart 9: China retail color TV 2006-2012 (k units); 2011 market share rankings
Chart 11: Types of online video firm in China and share of advertisement revenues, 1Q12
Chart 12: Size and growth rates for China online video market, 2009-2013 (CNYm)
CMMB is already the world's biggest mobile broadcast TV network
Lack of content and interactivity a bottleneck to CMMB development
Chart 14: User numbers and year-on-year growth rates for IPTV in China, 2006-2012
Chart 19: Changes to IPTV business model before and after tri-network convergence
Chart 20: Strengths and weaknesses of China's video websites
Chart 23: China video website revenue share from advertising, 4Q11
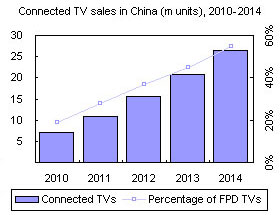
Chart 24: Shipments and penetration rates of connected TVs in China (m units)
Chart 25: Ranking sahre of flat-panel TV sales in China, 2011
Chart 28: Competitions between smart TV and connected TV platforms
Variations in mobile video services among the three main providers
Table 3: Mobile video service strategies among three largest telecom providers
Continuous efforts to increase market share in mobile phone video content
Chart 29: Mobile phone service customers and market share of video content providers
