

News subscription required to download the report. Please sign in if you wish to continue.
Digitimes Research predicts that the output value of China's IC foundry industry will reach US$3.29 billion in 2012, up 13.7% from US$2.89 billion in 2011. Looking into 2013, the output value for China's IC foundry sector will see a modest 2.1% increase to US$3.36 billion. In Taiwan, the foundry sector will report US$21.95 billion and US$23.32 billion, respectively, in output value for 2012 and 2013. The former figure and the latter represent growth of 11.8% and 6.2%, respectively.
Abstract
Digitimes Research predicts that the output value of China's IC foundry industry will reach US$3.29 billion in 2012, up 13.7% from US$2.89 billion in 2011. Looking into 2013, the output value for China's IC foundry sector will see a modest 2.1% increase to US$3.36 billion. In Taiwan, the foundry sector will report US$21.95 billion and US$23.32 billion, respectively, in output value for 2012 and 2013. The former figure and the latter represent growth of 11.8% and 6.2%, respectively.
Chip suppliers' demand for 28nm and below technology products will be strong in 2012, and the trend is expected to continue in 2013. On the supply side, both Samsung and Globalfoundries are looking to build new capacity which will likely cause the overall foundry capacity to exceed demand in 2013. Competition in the global foundry market will also be intense, and any structural change in the industry will depend on companies' progress in the development of 28nm and more advanced process technologies.
Table of contents
Chart 1: China IC foundry industry output value, 2007-11 (US$b)
Table 2: Major China foundries: Capacity and process offerings
Chart 2: Taiwan IC foundry industry output value, 2007-11 (US$b)
Chart 3: SMIC 8- and 12-inch fab capacity, 1Q10-2Q12 9 (K 8-inch equivalent wafers)
Chart 7: SMIC sales ratio for advanced and mainstream process technologies, 1Q10-2Q12 (US$m)
Hua Hong NEC, Grace Semiconductor and Shanghai Huali Microelectronics (HLMC)
Chart 8: Grace Semi, Hua Hong NEC and HLMC: Technology roadmap, 2009-13
Chart 11: SMIC 8- and 12-inch fab capacity, 1Q10-2Q12 9 (k 8-inch equivalent wafers)
Chart 12: CSMC revenues, revenue breakdown by application, 2010-11 (US$m)
Chart 15: ASMC sales breakdown by customer type, 3Q10-2Q12 (US$m)
Chart 16: TSMC capacity at 6-, 8- and 12-inch fabs, 3Q10-2Q12 (k 8-inch equivalent wafers)
Chart 20: TSMC sales by advanced and mainstream process technologies, 3Q10-2Q12 (US$b)
Chart 21: UMC capacity at 6-, 8- and 12-inch fabs, 3Q10-2Q12 (k 8-inch equivalent wafers)
Chart 24: UMC sales breakdown share by process node, 3Q10-2Q12
Chart 25: UMC revenues by advanced and mainstream process technologies, 3Q10-2Q12(US$b)
Chart 26: Powerchip foundry revenues and product offering, 2010- 1H12 (US$m)
Chart 27: Top-4 Greater China foundries revenues, 1Q10-4Q12 (US$m)
Chart 28: Top-4 Greater China foundries, combined revenues by application, 1Q10-4Q12 (US$m)
Chart 29: Top-4 Greater China foundries, combined revenues by customer type, 1Q10-4Q12 (US$m)
Chart 30: Top-3 Greater China foundries, combined revenues from IDM sector, 1Q10-4Q12 (US$m)
Chart 31: Top-4 Greater China foundries, combined revenues by process technologies, 1Q11-4Q12 (US$m)
Chart 33: Top-4 Greater China foundries, advanced process revenues, 1Q10-4Q12 (US$m)
Chart 34: Top-3 Greater China foundries, advanced process market share, 4Q11 and 4Q12
Chart 35: Top-3 Greater China foundries technology roadmap, 1H11-1H15
Chart 37: Top-4 Greater China foundries capacity, 1Q11-4Q12 (k 8-inch equivalent wafers)
Chart 40: Top-4 Greater China foundries, foundry ASP, 1Q10-4Q12 (US$)
Chart 41: TSMC sales breakdown by application, 2009-2013 (US$m)
Chart 42: UMC sales breakdown by application, 2009-2013 (US$m)
Chart 43: VIS sales breakdown by application, 2009-2013 (US$m)
Chart 44: SMIC sales breakdown by application, 2009-2013 (US$m)
Chart 46: Value of inventory held by major chip suppliers, 1Q10-2Q12 (US$b)
Chart 48: Global semiconductor industry output value, 2007-2013 (US$b)
Chart 49: China IC foundries revenue forecast, 2012-13 (US$m)
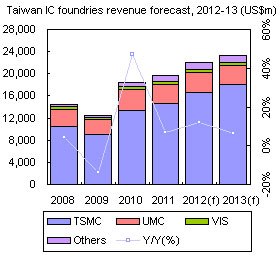
Chart 50: Taiwan IC foundries revenue forecast, 2012-13 (US$m)

