

Asustek Computer has announced its new ASUS P7F7-E WS SuperComputer motherboard, which integrates technologies such as USB 3.0, SATA 6G storage interface, and IEEE 1394b FireWire standard.
The P7F7-E WS adopts Intel 3450 chipset with integrated graphics as well as LGA 1156 socket for support of Intel's latest Xeon and Core processors.
The motherboard also supports up to four graphics cards through AMD's CrossFireX or Nvidia's 3-way/2-way SLI technologies.
The motherboard is embedded with six memory slots and supports up to 16GB of DDR3 memory, while Asustek's exclusive GPU Boost technology can overclock the integrated GPU in real time for a higher graphics performance.
| Asustek P7F7-E WS SuperComputer motherboard specifications | |
| Item | Detail |
| CPU support | Intel Xeon 3400 series, Core i7/Core i5/ Core i3/Pentium processors with supports of Intel Turbo Boost technology |
| Chipset | Intel Ibex Peak 3450 chipset/ Nvidia NF200 |
| Memory | 6 DIMMs, supporting up to 16GB DDR3 2000/1600/1333MHz, ECC, un-buffered memory |
| Expansion slots | Four PCI Express 2.0 x16 and three PCI Express x1 |
| Multi-GPU | Supports 3-way/2-way Nvidia GeForce SLI technology and AMD's CrossFireX technology, up to four graphics cards |
| Storage | Two SATA 6Gb/s and six SATA 3Gb/s |
Source: Company, compiled by Digitimes, March 2010
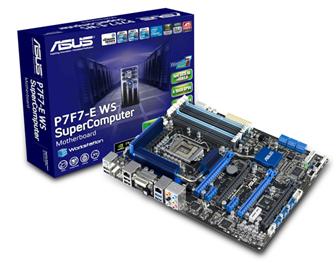
Asustek P7F7-E WS SuperComputer motherboard
Photo: Company
