As mobile phones and other portable products have switched en masse to touchscreens, and sales of tablet devices have taken off in 2010 under the influence of Apple's iPad, the touch panel market is expected to exhibit rapid growth over the coming years, with annual growth approaching 20% expected through 2013.
China is the world's largest producer of touch panels and China and Taiwan combined to account for close to 80% of touch modules for handsets shipped in 2010.
Taiwan-based touch panel manufacturers' advantages in terms of capacity, yield and production costs have allowed them to achieve excellent shipment results during the current touchscreen craze. The most thriving application sectors for small- to medium-size touch panels include mobile phones and tablet devices. In terms of touch panel modules for mobile phone use, Taiwan-based manufacturers' shipments are predicted to reach 280 million in 2011; all the touch modules used by the iPad are sourced from Taiwan-based manufacturers, while Taiwan-based firms' estimated shipments of touch modules for tablet devices other than the iPad are predicted to reach 1.77 million units in 2010, rising to 10.82 million in 2011.
This DIGITIMES Special Report provides an overview of the key technologies, applications and industry players in the Greater China region influencing growth in the global small- to medium and large-size touch panel market through 2013.
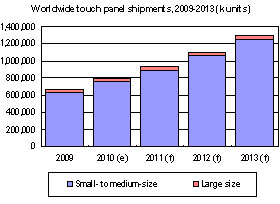
Chart 1: Worldwide touch panel shipments, 2009-2013 (k units)
Worldwide touch panel shipment forecast by application, 2010-2013
Chart 2: Global small- to medium-size touch panel shipments by application, 2009-2013 (k units)
Chart 3: Global large-size touch panel shipments by application, 2009-2013 (k units)
Chart 4: Global small- to medium-size touch panel shipments by technology, 2009-2013 (k units)
Chart 5: Global small- to medium-size touch panel shipment share by technology, 2009-2013
Chart 6: Global large-size touch panel shipments by technology, 2009-2013 (k units)
Chart 7: Global large-size touch panel shipment share by technology, 2009-2013
Worldwide touch panel revenue forecasts by application, 2010-2013
Chart 8: Global production value of touch panel shipments, 2009-2013 (US$m)
Chart 9: Global small- to medium-size touch panel production value by application, 2009-2013 (US$m)
Chart 10: Global small- to medium-size touch panel production value share by application, 2009-2013
Chart 11: Global large-size touch panel production value by application, 2009-2013 (US$m)
Chart 12: Global large-size touch panel production value share by application, 2009-2013
Worldwide touch panel revenue forecasts by technology, 2010-2013
Chart 13: Global small- to medium-size touch panel production value by technology, 2009-2013 (US$m)
Chart 14: Global small- to medium-size touch panel production value share by technology, 2009-2013
Chart 15: Global large-size touch panel production value by technology, 2009-2013 (US$m)
Chart 16: Global large-size touch panel production value by technology, 2009-2013
Mobile phone application touch panel shipment forecasts, 2010-2013
Chart 17: Worldwide smartphone shipments and penetration rate, 2007-2011 (m units)
Chart 18: Average pricing of resistive touch panels used in white box phones, 2008-2011 (US$)
Chart 19: Mobile phone shipments by China-based manufacturers, 2004-2013 (m units)
Chart 20: Global mobile phone touch panel shipments by technology, 2006-2013 (k units)
Chart 21: Global mobile phone touch panel shipment share by technology, 2006-2013
Chart 22: Global resistive touch panel shipments for mobile phone, 2006-2013 (k units)
Chart 23: Global projected capacitive touch panel shipments for mobile phones, 2006-2013 (k units)
Tablet application touch panel shipment forecasts, 2010-2013
Chart 24: Global shipments of touch panels for tablet devices by technology, 2009-2013 (k units)
Chart 25: Global shipment share of touch panels for tablet devices by technology, 2009-2013
Chart 26: Global shipments of tablet device touch panels by customer, 2010- 2013 (k units)
Chart 27: Global shipment share of tablet device touch panels by customer, 2010- 2013
Shipment forecasts for touch panels for use in PCs, 2010-2013
Chart 31: Global touch panel shipment share by technology for notebook PC applications, 2009-2013
Chart 34: China-based manufacturers' forecast touch panel shipments, 2009-2013 (k units)
Chart 35: China's touch panel supply chain's 3 business models
Chart 37: China touch panel supply chain for glass-type projective capacitive touch panels
Chart 39: China-based manufacturers' small- to medium-size touch panel shipment share, 2009-2013
Chart 40: Major China-based large-size touch panel manufacturers and their major technological focus
Chart 41: China-based manufacturers' large-size touch panel shipment forecast, 2009-2013 (K units)
Taiwan-based touch panel manufacturers: Mobile phone applications
Chart 43: Global shipments of mobile phone touch modules, 2006-2011 (k units)
Chart 44: Global shipment share of mobile phone touch modules, 2006-2011
Major touch panel module suppliers in Taiwan: Mobile applications
Chart 47: Mobile phone touch module shipments from Taiwan's Top-3 makers, 2006-2013 (k units)
Table 1: Major Taiwan touch module makers' capacity expansion plans
Chart 50: Impact of TFTLCD panel makers entering projective capacitive touch panel market
Greater China touch panel controller IC industry and shipment forecast
Chart 51: Touch IC shipments from China and Taiwan, 2009-2011 (k units)
Chart 52: Touch IC shipments by supplier, China and Taiwan, 1Q10-2Q11 (k units)
Chart 53: Touch IC shipment share by supplier, China and Taiwan, 1Q10-2Q11
Chart 54: Touch IC shipments by application from China and Taiwan, 1Q10-2Q11 (k units)
Chart 55: Touch IC shipment share by application from China and Taiwan, 1Q10-2Q11
Chart 56: Touch IC shipment share by customer tier, for handset applications, 1Q10-2Q11
Chart 57: Touch IC shipments by customer tier, for tablet applications, 1Q10-2Q11 (k units)
Major applications for Greater China projected capacitive touch panel controller IC suppliers
Chart 59: Touch IC shipment by technology, 1Q10-2Q11 (k units)