Figure 1. AI boom timeline
Figure 2. AI technology relationship diagram
Figure 3. Key LLM trends for 2026
Figure 4. M-shaped LLM parameter trend
Figure 5. LLM feature highlights
Figure 6. AI technology trends
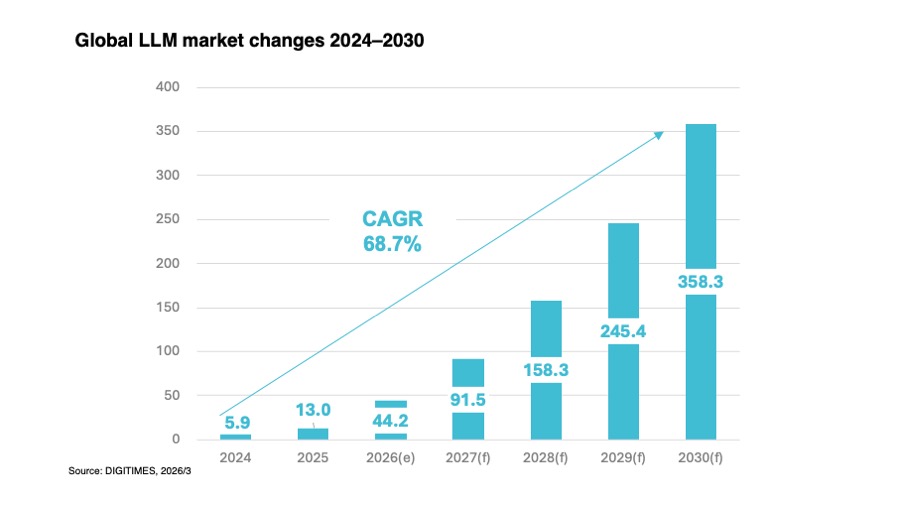
Figure 7. Global LLM market size, 2024–2030
Figure 8. Generative AI market forecast, 2028
Figure 9. Generative AI chatbot hot spots, 2025–2028
Figure 10. Generative AI software development hot spots, 2025–2028
Figure 11. Generative AI image generation hot spots, 2025–2028
Figure 12. Generative AI video generation hot spots, 2025–2028
Figure 13. Enterprise operations automation hot spots, 2025–2028
Figure 14. Process automation hot spots, 2025–2028
Figure 15. Compute deployment factors for generative AI applications
Figure 16. Enterprise AI adoption conditions challenges
Figure 17. Enterprise AI service resources and characteristics
Figure 18. Enterprise AI deployment decision factors
Figure 19. Enterprise AI service supplier landscape
Figure 20. CSP AI service offerings and strategies
Figure 21. Enterprise software vendors' AI strategies
Figure 22. Enterprise IT vendors' AI strategies
Figure 23. AI model startups' enterprise strategies
Figure 24. Supplier positioning and cloud share comparison
Figure 25. Enterprise AI architectures: current and outlook
Figure 26. Supplier advantages and application scenarios
Figure 27. Enterprise AI market drivers and trends
Figure 28. Enterprise AI market outlook
Figure 29. LLM training compute demand forecast
Figure 30. OpenAI o1 model accuracy: training vs inference
Figure 31. Key factors in inference hardware performance
Figure 32. Nvidia Hopper vs Blackwell inference performance
Figure 33. Cloud capex YoY forecast, 2022–2027
Figure 34. AI workload requirements for critical server components
Figure 35. Nvidia traditional vs Dynamo inference
Figure 36. Rubin CPX vs Rubin200 GPU specs
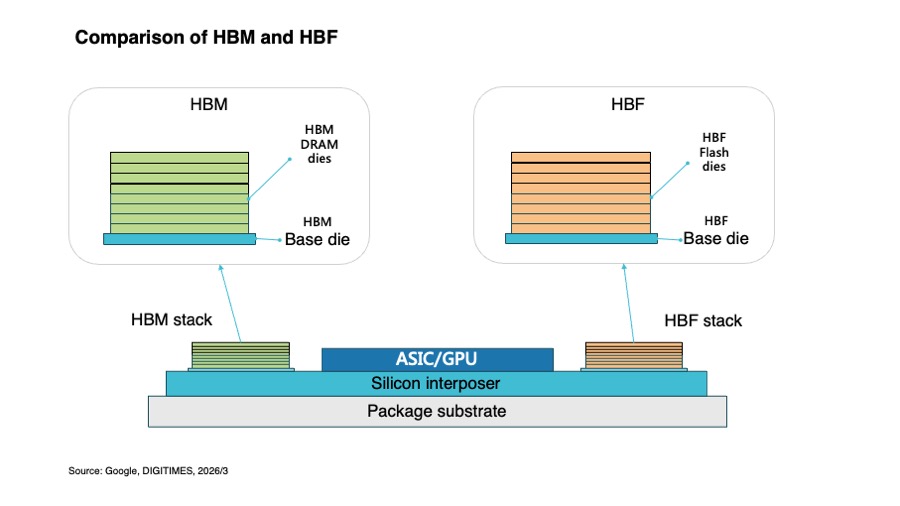
Figure 37. HBM vs HBF packaging comparison
Figure 38. 3D memory-logic stacking architecture
Figure 39. Google AI IaaS evolution
Figure 40. Google AI SaaS evolution
Figure 41. Google accelerator adoption and outlook
Figure 42. Google high-end AI server shipments, 2023–2028
Figure 43. Amazon AI IaaS evolution
Figure 44. Amazon accelerator adoption and outlook
Figure 45. Amazon high-end AI server shipments, 2023–2028
Figure 46. Microsoft AI IaaS evolution
Figure 47. Microsoft AI SaaS evolution
Figure 48. Microsoft AI PaaS evolution
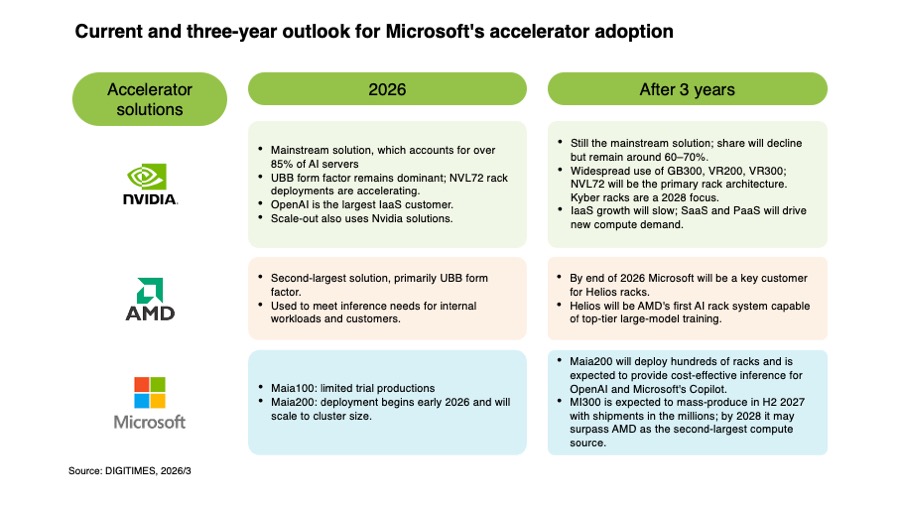
Figure 49. Microsoft accelerator adoption and outlook
Figure 50. Microsoft high-end AI server shipments, 2023–2028
Figure 51. Oracle AI IaaS evolution
Figure 52. Oracle AI PaaS evolution
Figure 53. Oracle AI SaaS evolution
Figure 54. Oracle accelerator adoption and outlook
Figure 55. Oracle high-end AI server shipments, 2023–2028
Figure 56. Traditional vs GEM-model recommender comparison
Figure 57. Meta accelerator adoption and outlook
Figure 58. Meta high-end AI server shipments, 2023–2028
Figure 59. xAI LLM training compute demand forecast
Figure 60. xAI high-end AI server shipments, 2023–2028
Figure 61. ChatGPT vs Claude feature comparison
Figure 62. OpenAI accelerator adoption and outlook
Figure 63. OpenAI high-end AI server shipments, 2023–2028
Figure 64. Anthropic accelerator adoption and outlook
Figure 65. Anthropic high-end AI server shipments, 2023–2028
Figure 66. Global high-end AI server shipments, 2023–2028
Figure 67. Market share by major players, 2023–2028
Figure 68. Market share by accelerator platforms, 2023–2028