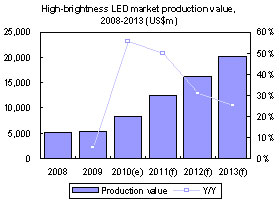
LED production value is projected to reach US$8.25 billion in 2010, up 55.6% from a year ago on the rapid growth of the LED TV segment. LED TV shipments in 2010 are estimated to increase 10-fold on year from 2009 to 37.20 million units.
From 2011 to 2013, global LED production value will rise by at least 25% every year. In addition to the rise of LED TV applications, LED lighting will begin to replace conventional lighting technology in the market.
However, while LED lighting's luminous efficiency is currently comparable to that of fluorescent lamps, LED lamps remain unpopular mainly because of their high costs. Obviously, high costs make it difficult to adopt LED lighting unless governments offer subsidies or consumers realize that total costs for LED lighting may not be higher if its power savings, longer service life, lower carbon emissions and other advantages are taken into consideration.
This DIGITIMES Research Special Report provides an extensive overview of the high-brightness LED market, including a breakdown of the LED TV supply chain in Taiwan, Korea, Japan and China, an overview of government LED lighting policies by region, and a timeline for the transition to LEDs in the global lighting market.
Chart 1: High-brightness LED market production value, 2008-2013 (US$m)
Chart 2: High-brightness LED shipments by application, 2008-2013 (m units)
Chart 3: High-brightness LED production value share by application, 2008-2013
Chart 4: Penetration rate of high brightness LEDs for LCD and lighting applications, 2008-2013
Chart 5: Worldwide shipments of LED TVs and LCD TVs, 2008-2013 (k units)
Chart 16: Seoul Semiconductor's customers from LED TV segment
Taiwan: Evertop Optoelectronics: LED packaging JV of TPV, Everlight and Epistar
Chart 19: Role of Evertop Optoelectronics in the LED TV supply chain
Chart 21: Price trend of LED BLU for 40-inch TV, 2008-2013 (US$)
Chart 22: Price difference between LED and CCFL BLU for 40-inch TV, 2008-2013
Chart 24: Breakdown of electricity consumption in residential buildings, 2006
Chart 25: Breakdown of electricity consumption in commercial buildings, 2006
Table 9: Comparison of solid-state and traditional lighting efficiency, 2009
Chart 26: US milestone targets for LED lighting, FY2008-FY2020
Chart 30: US DOE subsidies and private investments under SSL Project as of Feb 2010 (US$m)
Chart 31: SSL Project investment share by segment as of Feb 2010
Japan: Next-generation technology to grab 100% share of lighting market by 2020
Chart 33: Development of Japan's zero energy building policy
Chart 34: Electricity consumption by residential buildings, 2008
Chart 35: Electricity consumption by commercial buildings, 2008
Japan: NEDO-led development plan aims to double luminous efficacy
Table 12: Targets for NEDO's next-generation lighting development
Japan: National and regional incentive programs for LED development
Table 13: Japanese local government energy conservation subsidization
Table 14: Japanese local government LED lighting subsidization
Chart 39: Forecast of Japan's LED and OLED market, 2009-2015 (b yen)
Korea: Four major policies to achieve 30% penetration for LED lighting by 2015
Korea: Government organizations and public lighting are focus of initial LED lighting demand
Chart 43: LED lighting requirements for government organizations
Table 15: Savings from Gwanggyo urban development projects and LED adoption
Table 16: Two phases to improve LED lighting efficiency and product lifetime, 2009-2016
Table 17: Development of LED lighting certification standards, 2002-2012
Chart 45: Number of certified companies and LED lighting products, end of 2009
Table 18: Standards for changeable and fixed LED luminaires, 2009-2012
Chart 46: Development of regional industrial parks for LED lighting
Chart 50: Lighting as a share of China's electricity consumption, 2009
Table 19: China's national-level policy for solid-state lighting
Chart 52: China lighting products' global market share, 2009
Chart 53: China LED production value share by application, 2009
Chart 54: Distribution of China-based LED companies along the supply chain, 2010
Table 21: China's policies on the development of LED lighting industries
Chart 55: China plans to construct 7 national LED industrial parks
Chart 57: Future development strategy of China's LED industry
Chart 58: Luminosity of China-made LED chips and future developments (lm/W)
Chart 59: China's 2020 targets for economic growth and environmental protection
Chart 62: Cree revenues by product segment, FY 2006-2010 (US$ m)
Chart 64: Cree LED revenue share by application, fiscal 4Q10, 4Q11
Chart 66: Cree LED indoor, outdoor lighting difference in luminous flux by color temperature
Chart 70: Osram LED lighting's improvement in lumen value, 2001-2010 (lm)
Table 26: Osram LED lighting development and planning, 2007-2011
Chart 72: Philips' share of revenues by market segment, 2Q09-2Q10
Chart 73: EBITA of Philips' lighting division, 2Q09-2Q10 (m euro)
Chart 74: Philips Lumileds uses high current drive to maintain high luminous efficacy
Table 27: Philips' development of indoor and commercial LED lighting
Chart 77: Position of mid-term plan GT12 in Panasonic' s development
Chart 78: Major directions and goals of Panasonic's GT12 plan
Table 29: Panasonic's major products and production departments of energy-related businesses
Chart 80: Panasonic LED lighting revenue share by product category, 2010
Chart 81: Panasonic's LED lighting sales plan till 2015 (b yen)
Table 33: Toshiba Lightech's plans of in-house production for LED components and lighting
Chart 85: Toshiba Lightech's overseas LED lighting operations
Chart 86: Breakdown of Samsung's 23.3 trillion won investment in new sectors, 2010-2020
Chart 87: Breakdown of Samsung's target revenues of 49.8 trillion won from new sectors, 2020
Table 35: Expanded investments by Samsung in five major sectors until 2020
Chart 88: Location and deployment of Samsung LED's three factories in South Korea
Chart 90: LG Innotek's LED business revenues by application, 1Q10-2Q10 (b won)
Chart 91: Seoul Semiconductor's financial performance, 2006-2010 (b won)
Chart 92: Seoul Semiconductor revenues by application, 2006-2010 (b won)
Chart 93: Seoul Semiconductor revenue shares by application, 2006-2010
Chart 94: Average cost for LED lighting, 2007- 2013 (US$/klm)
Chart 95: Advance in LED luminous efficacy and comparison with other lighting technologies
Chart 96: Global market value of LED lighting, 2008-2013 (US$m)
Chart 97: Global light bulb market volume and LED penetration, 2009-2013 (m units)
Table 28: Performance of Philips home-use indoor LED lighting