
VIA Technologies has announced the VIA VB7009 embedded Mini-ITX motherboard. Measuring only 17x17cm, the VIA VB7009 Mini-ITX is a flexible embedded board for POS and kiosks.
The VIA VB7009 is a solution offering a range of power efficient VIA CPU choices, including the dual core VIA Nano X2 processor, providing superior flexibility to match customers' embedded computing needs. Paired with the VIA VX900 unified all-in-one media system processor, the VIA VB7009 Mini-ITX embedded board delivers a platform supporting video resolutions of up to 1080p.
The VIA VB7009 Mini-ITX embedded board offers a variety of CPU choices ranging from a fanless 1.0GHz VIA C7 to either a 1.6GHz VIA C7-D or 1.2GHz dual core VIA Nano X2 processor. In addition to enabling support for up to 4GB of DDR3 system memory, the VIA VX900 MSP features the VIA ChromotionHD 2.0 video processor.
Rear I/O includes one VGA port, four USB 2.0 ports, one COM port, two Gigabit Ethernet ports, one PS/2 keyboard/mouse port and three audio jacks for line-in/out and mic-in. Onboard pin headers provide support for an additional four USB 2.0 ports, three COM pin headers, an LPC connector, SMBus connector, PS/2 support, audio jacks, and LVDS. The VIA VB7009 is fully compatible with Microsoft and the most popular Linux operating systems and is available in a variety of configurations.
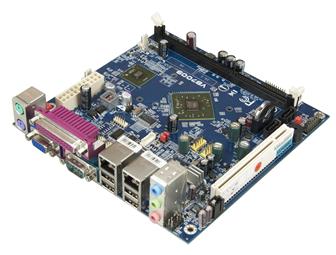
VIA VB7009 embedded Mini-ITX motherboard
Photo: Company
