

Nvidia has introduced the Quadro Digital Video Pipeline, which it claims is the industry's first integrated GPU-based platform for broadcasters to acquire, process and deliver virtual effects to video.
The solution offers a graphics computation engine for broadcast production, in a flexible, reliable and cost-effective PC-based platform. By providing a direct path for image processing into and out of the GPU, it allows professionals to incorporate higher quality, graphic-rich broadcasts in real time. It also offers a path for capturing and transcoding HD broadcast-quality video for use in real-time Internet streaming services, said Nvidia.
The Quadro Digital Video Pipeline platform integrates components including a Quadro SDI Capture card which enables uncompressed video to be streamed directly to Quadro SDI-enabled GPU memory, and offers the ability to capture up to four HD-SDI Single link sources simultaneously.
The Quadro SDI Output card provides an integrated graphics-to-video solution, enabling 2D and 3D effects to be composited in real-time with 2K, HD and SD video. It can be genlocked to external house sync, or synced to the SDI Capture card.
Quadro FX professional GPU solutions include the latest generation Quadro FX 3800, Quadro FX 4800 and Quadro FX 5800 graphics cards.
The Quadro Digital Video Pipeline SDK includes an software development kit (SDK) containing samples, APIs and plug-ins that allow applications to optimize the graphics and data processing pipelines of the Quadro GPU.
Nvidia's Quadro Digital Video Pipeline will ship August 2009 at estimated prices ranging from US$5,000 to US$8,000 depending on configuration.
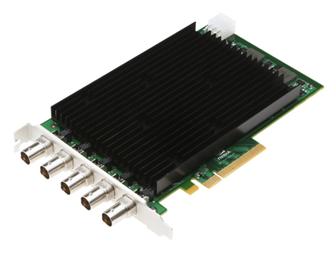
Nvidia Quadro SDI Capture card
Photo: Company
