

Lanner Electronics has released the LEC-2026, an embedded system with a specialized focus on network capabilities. The LEC-2026 is driven by the N270 Intel Atom CPU and the Intel 945GSE and ICH7M chipset. It supports six Intel Gigabit Ethernet LAN ports, each with its own network controller, to ensure high throughput for network communication and vision control applications. The extended temperature specification and fanless design allows the LEC-2026 to thrive in harsh environments.
The LEC-2026 is designed for vision control applications. Vision control is a real-time video monitoring system for quality control. The system is designed for IA and other manufacturing environments ensure the proper placement of components. For example in motherboard manufacturing a vision control system would be included in the various chip shooters to ensure each component was placed correctly. The vision control's digital Gigabit Ethernet cameras are mounted inside the machine and are connected to the external IPC. Software on the IPC will then use the cameras to constantly assess each placed chip. This analysis happens in real time, so the IPC does not retain any of the video footage, and therefore is not reliant on storage space.
The LEC-2026 is designed for use with vision control, by having separate high bandwidth Gigabit Ethernet ports, each with their own separate controller. This ensures that the data stream will have a continuously high bandwidth. With six Intel Gigabit Ethernet LAN ports the LEC-2026 can run up to six cameras.
To promote longevity the LEC-2026 is fanless, while still boasting an extended temperature range between -10-degrees and 55-degrees Celsius. One reason the unit can support fanless design is the low power threshold involved in the N270 Intel Atom CPU which still boasts 1.6GHz of processing ability, Lanner highlighted. Heat dispersing fins along the chassis ensure the unit will remain cool in even the harshest industrial settings.
Other connections include two USB 2.0 ports, one RJ45 COM port and a VGA port for attaching monitors. With 2.5-inch SATA HDD support and a CF socket this aluminum cased SFF computer can utilize various operating systems (including XPE and Linux Kernel 2.4.16) and serve many different applications, Lanner said.
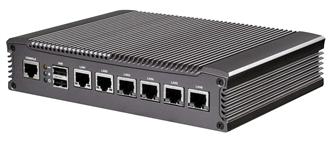
Lanner LEC-2026 embedded system with a specialized focus on network capabilities
Photo: Company

