

Micro-Star International (MSI) has recently rolled out the CX413, the latest member of its Classic series of notebooks. The 14-inch CX413 comes packed with AMD's all-new Vision (Danube) platform with AMD's Athlon II dual-core processor, supporting DDR3 memory as well as an ATI Mobility Radeon HD 5470 discrete graphics card (DDR3 512MB display memory).
The CX413 features a Cinema-class LED display with 16:9 ratio and MSI's own 45-degree beveled construction.
The CX413 adopts MSI's exclusive ECO engine power-saving technology to enhance power efficiency and optimize the notebook's battery power.
| MSI CX413 notebook specifications | |
| Item | Detail |
| CPU | AMD Athlon II dual-core processor P320 |
| OS | Windows 7 Home Premium |
| Memory | DDR3 1066 |
| Display | 14-inch HD LED backlight (16:9) |
| Graphics | ATI Mobility Radeon HD 5470 with 512MB RAM |
| Video Output | One HDMI, One VGA |
| Hard Disk Drive | 250/320/500GB |
Source: Company, compiled by Digitimes, September 2010
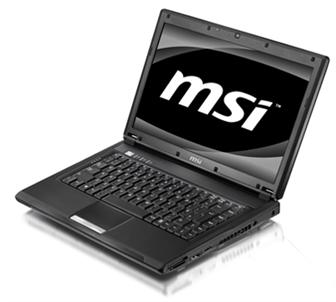
MSI CX413 notebook
Photo: Company

