
VIA Technologies has announced the two latest VIA modules in the growing VIA Modular Solutions portfolio, the VIA COMe-8X92 and the VIA QSM-8Q90. The modular design approach allows for short time-to market, application-specific customization, simplified development, high stability and long life cycles allowing customers to rapidly develop new and exciting devices.
Measuring 95mm by 95mm, the VIA COMe-8X92 is based on the industry standard Computer-on-Module (COM) Express Compact form factor, developed and maintained by the PCI Industrial Computer Manufacturers Group (PICMG). The VIA COMe-8X92 module combines a 1.2GHz VIA NanoTM X2 E-series dual-core processor and the VIA VX900H media system processor (MSP) providing a ruggedized solution targeted at industrial PC and large OEM customers focused on dynamic application segments, including medical, advanced gaming, industrial automation and digital signage.
The VIA QSM-8Q90 module measures just 70mm by 70mm and is based on the new embedded QSeven form factor developed to meet the demands of various low-power and mobile applications. Featuring a VIA 1.0GHz VIA Nano E-series processor and the VIA VX900 MSP, the VIA QSM-8Q90 module is the ideal building block for power constrained handheld application segments, including medical, advanced gaming, military and test and measurement equipment.
In addition with the VIA COMe-8X92 and VIA QSM-8Q90 modules, VIA offers comprehensive starter kits, including a multi-I/O carrier board reference design, (and a 7-inch LVDS display with the QSM-8Q90), board support packages (BSPs), display, system monitoring tools/SDKs, and design guide, enabling industrial PC and OEM customers to rapidly customize their solutions.
The VIA COMe-8X92 module also offers support for the latest connectivity standards including 18/24-bit single-channel LVDS, VGA, Display Port and HDMI with onboard I/O includes two SATA II ports, one GigaLAN port, one USB client port (shared with one of four USB 2.0 ports), four USB 2.0 ports, SDIO, expansion buses for one PCIe X4 and one PCIe x1 and the VIA Labs VL800 USB 3.0 host controller which offers support for four USB 3.0 ports. System memory support includes one slot for up to 4GB of SODIMM DDR3 RAM.
The VIA QSM-8Q90's on-board system memory includes 1GB of DDR3 RAM as well as support for two 1-lane PCIe expansion and an18/24-bit LVDS connector with resolutions up to 1366 by 768.
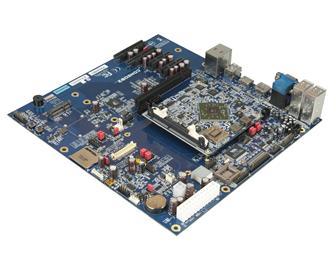
VIA COMe-8X92 system-on-module solution
Photo: Company
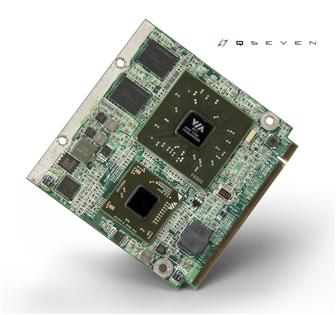
VIA QSM-8Q90 system-on-module solution
Photo: Company

