
Micro-Star International (MSI) has announced its latest gaming notebook - GT780DX, featuring quad-core Intel Core i7 CPU and the latest Nvidia GeForce GTX 570M discrete graphics card that is equipped with 3GB of GDDR5 display memory.
The machine is also equipped with 32GB of DDR3 memory and RAID 0-based accelerated dual hard disk architecture for its hard drive system to allow storage capacity to double and read-write speed to increase by 70%, the vendor said.
Meanwhile, MSI also adds its Turbo Drive Engine (TDE) technology to the machine to ramp up its overall performance. To quickly cool down the system to maintain its stability, MSI also has Cooler Boost technology.
| MSI GT780DX notebook specifications | |
| Item | Detail |
| CPU | Intel Core i7 processor |
| OS | Windows 7 Ultimate/Professional/Home Premium |
| Memory | DDR3 up to 32GB |
| Display | 17.3-inch Full HD |
| Graphics | Nvidia GeForce GTX 570M / 3GB GDDR5 |
| Video Output | 1x HDMI, 1x VGA |
| HDD |
750GB SATA 7200rpm + Intel 120GB SSD or 500GB SATA 7200rpm + Intel 120GB SSD or 750GB (4K sector) x2 or 750GB SATA 7200rpm x2 or 500GB SATA 7200/5400rpm x2 |
| ODD | Blu-ray / DVD Super Multi |
| Interfaces |
2x USB 3.0, 3x USB 2.0, 1x eSATA, SD(XC/HC)/MMC/MS(PRO)/xD card reader |
| Sound | Sound by Dynaudio, THX TruStudio Pro |
| Dimension (WxDxH) | 428 x 288 x 55mm |
| Weight | 3.9Kg (w/ Battery) |
| Other Features |
Keyboard by SteelSeries TDE (Turbo Drive Engine) Cooler Boost |
Source: Company, compiled by Digitimes, December 2012
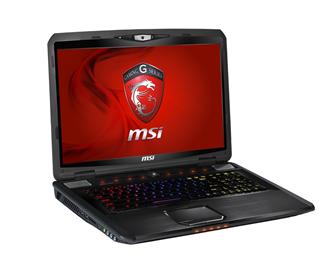
MSI GT780DX notebook
Photo: Company

