

VIA Technologies has announced the VIA EPIA-T700, the first motherboard based on the recently announced Mobile-ITX form factor. Measuring 6×6cm, the VIA EPIA-T700 is a compact computer-on-module designed for a range of ultra-compact embedded devices in medical, military and in-vehicle applications, said VIA.
The VIA EPIA-T700 can be used with a variety of carrier boards that can be adapted and customized to meet the needs of a range of applications and is powered by a specially miniaturized 1GHz VIA Eden ULV processor and the compact VIA VX820 media system processor that together offer I/O flexibility, said VIA.
The VIA EPIA-T700 features 512MB of DDR2 on-board system memory.
The VIA VX820 media system processor adds several key features including a VIA Chrome9 DirectX 9 integrated graphics core, VIA Chromotion video engine with hardware acceleration for MPEG-2, MPEG-4, WMV9, and VC1 video formats, and VIA Vinyl HD Audio supporting up to eight-channel HD audio.
An integrated multi-configuration transmitter enables display connections to TTL LCD panels and CRT monitors. Added flexibility is provided through carrier board configurations that integrate a DVP interface to include LVDS and DVI support. Other integrated data bus technologies include PCI Express and Ultra DMA.
The VIA EPIA-T700 uses two high-density, low profile connectors on the under side of the module that can also withstand vibrations of up to 5Gs making Mobile-ITX systems suitable for in-vehicle and industrial machining applications, VIA said.
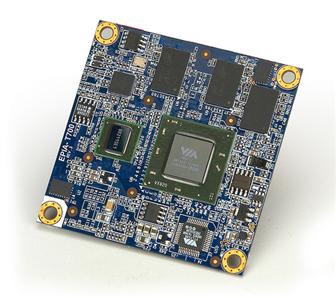
VIA EPIA-T700 Mobile-ITX motherboard
Photo: Company

