
Transcend Information has teamed up with Internet information search and management firm eSobi to offer its 4GB JetFlash V33-series USB flash drives with eSobi software in the Taiwan market, according to the company.
The eSobi integrated Internet tool allows users to improve Internet searching, streamline flow-based information, and save and manage findings for later use. It combines an RSS reader, a meta-search engine, a podcast receiver and an information library in one application.
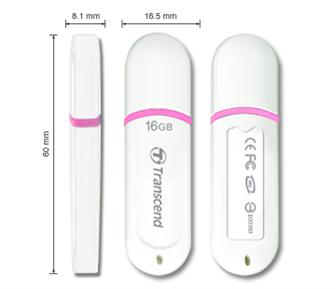
Transcend JetFlash V33
Photo: Company

