
A-Data Technology is exhibiting a host of products at Computex Taipei 2009, including high-performance memory modules, high speed CompactFlash (CF) cards, solid-state drive (SSD) products, portable hard disk drives, and USB flash drives.
The XPG Overclocking series memory modules and SSDs will be in the spotlight, and will include DDR3 2133X and the new DDR3 1866X modules, an Intel co-branded A-Data X25-M SSD, the ultra-high performance XPG series SX94 SSD with a capacity up to 512GB, the SATA II SSD S592 with performance up to 230/170MB per second for read/write speeds.
Moreover, the 3.5-inch SSD enclosure is upgraded with RAID functionality, with A-DATA indicating bench tests show that the new RAID function can boost SSD speed performance up to 150%.
A-Data is also displaying ultra-high-speed CompactFlash (CF) cards (CF600X).
The T806 Kissing Octopus Couple flash drive has just been announced as a winner of the Computex Taipei Design & Innovation Award 2009. The product won iF Design Award 2009 and Reddot Design Award 2009 as well. A-Data also won the Reddot Design Award for its CH91 portable hard disk and the S805 Carabiner drive. These products can also be viewed at the A-Data booth.
A-Data has also debuted several stylish USB flash drives and portable hard disk at Computex. One of A-Data's new products, the Theme series T906 USB flash drive, has a Disney theme, with Mickey and Minnie Mouse likenesses. Other new products include the NH92 portable hard disk for more mature consumers, and the sporty SH93 athletic yuppie portable hard disk.
A-Data is at the Nangang Exhibition Hall (Booths J818, J824, J1017, J1023).
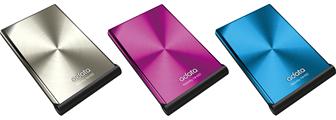
A-Data NH92 portable hard disk
Photo: Company
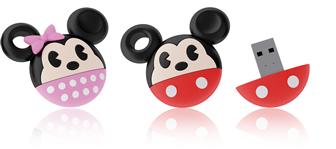
A-Data T906 USB flash drive
Photo: Company
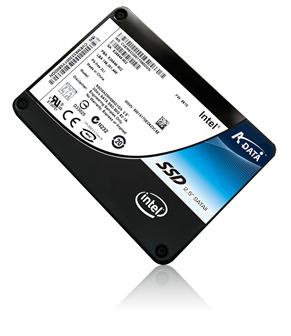
A-Data X-25M SSD
Photo: Company
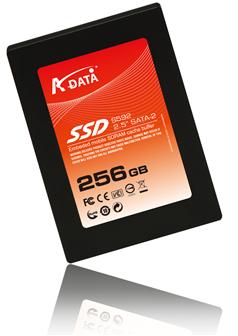
A-Data S592 SSD
Photo: Company
A-Data CF 600X
Photo: Company

