

Although first-tier notebook makers have taken most of the the spotlight, second-tier makers including Mitac Technology, First International Computer (FIC), Clevo and several China-based makers have been promoting their own product lineups at Computex 2008.
Mitac Technology showcased several own-brand rugged notebooks, handheld and tablet PCs. Its Getac B300 rugged notebook features an over 1200 nits display to enable users to read even in sunlight and also has a battery life up to 12 hours. The company also had on display the Getac PS535E, a completely rugged PDA.
In addition to rugged notebooks, the company also showcased an 18.4-inch Blu-ray notebook for the ODM market. The notebook is based on the Centrino 2 (Montevina) platform and will be able to support Full HD quality movies with its GeForce 9600M GS graphics card.
Currently, Mitac is focusing on its own-brand Getac rugged products and will continue to maintain its ODM business, noted a company representative. The company currently does not have any low-cost notebook (netbook) products.
FIC showcased its 8.9-inch CW0A1 and CE2A1 netbooks using Intel's Atom and VIA's C7-M platforms. The company also has a 10.2-inch model, the CW001.
Like Mitac, FIC also showcased the XY680D, an 18.4-inch, Centrino 2, and GeForce 9600M GS, "Blu-ray" notebook targeting ODMs.
Although FIC has its Everex brand business, a company representative noted shipments for own-brand products are not a lot and the company will continue to focus on its ODM business.
Clevo also showcased a netbook, the TN70M. Although the screen size is only 7-inch, it features similar rotate and touch screen functions as Gigabyte Technology's M912X. Clevo, like the other second-tier notebook makers, also showcased a Blu-ray notebook, but this model included only a 17-inch panel and GeForce 8800M GTX graphics.
Clevo noted that mass production of its TN70M will start at the beginning of August.
At VIA Technologies' booth, the company showcased netbooks from several China-based second-tier notebook makers all adopting its C7-M platform including Tsinghua Tongfang's Imini SI Mini-Note, Newbyte's S10 Mini-Note, Great Wall's A81 Mini-Note and Nagai Lilk 8010A Mini-Note.
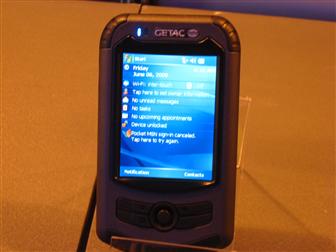
Getac PS535E rugged PDA
Photo: Joseph Tsai, Digitimes, June 2008
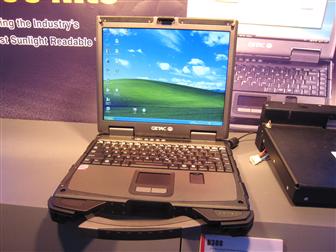
Getac B300 rugged notebook
Photo: Joseph Tsai, Digitimes, June 2008
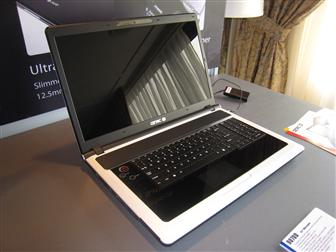
Mitac 9070D 18.4-inch Blu-ray notebook
Photo: Joseph Tsai, Digitimes, June 2008
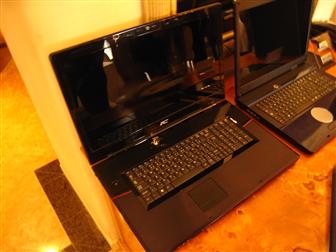
FIC XY680D 18.4-inch Blu-ray notebook
Photo: Joseph Tsai, Digitimes, June 2008
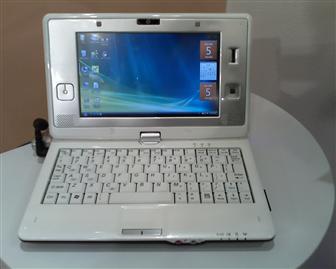
Clevo TN70M 7-inch low-cost notebook
Photo: Joseph Tsai, Digitimes, June 2008
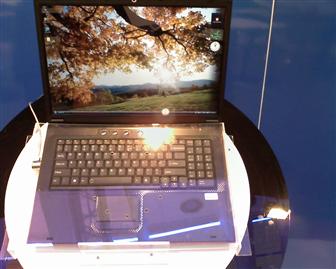
Clevo M570TU 17-inch Blu-ray notebook
Photo: Joseph Tsai, Digitimes, June 2008

