

Gigabyte Technology continues to develop products and innovations for the graphics card market and is focusing on enhancing its graphics cards to help them become professional products.
Gigabyte remains optimistic about the graphics card industry and is gradually moving into the enterprise sector. Digitimes recently interviewed Eddie Lin, associate vice president of Gigabyte's Graphics Card Business Unit about the efforts Gigabyte has put into the graphics card market as well as the company's strategy for the future.
Q: What products or technologies is Gigabyte focusing on for the VGA sector at Computex 2014?
A: Graphics cards are definitely the main focus of the VGA department and we are also showcasing our new improved air and liquid cooling modules to show our technological leadership in the market.
For the liquid cooling product line, we are showcasing our new WaterForce cooling module, designed for the top-end segment.
As for air cooling, we have improved the WindForce cooling module with an even higher heat dissipation rate.
We will also display our latest keyboards and mice at our booth including those under the Aorus brand.
Q: How is the graphics card market currently? How is Gigabyte performing in the market?
A: Graphics cards have already advanced to become more like boutique and professional products. At the very beginning, consumers purchased graphics cards to output images from their computers, but graphics cards now are used mainly for game play.
As demand for high-resolution games continues to rise, graphics card performance also needs to dramatically improve to handle the surging demand. Graphics cards need to handle about four times the workload to advance from Full HD to Ultra HD resolutions.
Therefore, in the short term, the graphics card industry will remain how it is now and consumers will continue to purchase graphics cards to play games.
Gigabyte's role in the industry is to grow even more professional over our technology and to develop innovations that satisfy consumer demand. Gigabyte's graphics cards have grown more professional and elegant and are turning more toward higher-end markets.
We have also improved our box art to enhance the professional impression of our graphics card products and have treated brand nurturing as a priority for future growth.
Q: Can you give us more detail on the company's WaterForce cooling system? Compared to other liquid cooling systems available on the market, what are the advantages that the system has?
A: We have seen our competitors release high-end graphics cards equipped with liquid cooling modules, but Gigabyte does not believe that is how liquid cooling should be adopted.
When gamers equip 2-3 high-end graphics cards into their desktops to run SLI, the lack of internal space can greatly affect the heat dissipation of their machines. Gigabyte's WaterForce cooling system is developed to resolve such an issue and is only used in multi-graphics card scenarios.
Our WaterForce system does not require chassis modifications, unlike most liquid cooling systems available in the market, which need a specially designed chassis. Users only need an empty 5.25-inch drive bay in their chassis to install the WaterForce.
The WaterForce also features a control panel, with which users can manually change cooling fan and water pump speeds for each graphics card. Users can also click a button to equalize all the graphics cards' temperatures.
WaterForce will be selling with three Nvidia high-end graphics cards, making its end price surpass US$3,000. Through the bundling, users will be able to install the system into their desktops right away, and will not need to be concern about their warranty.
As for whether we will use the system for AMD graphics cards, it will depend on how AMD graphics cards performance, as we only like to adopt the system with the highest performing graphics cards on the market.
Q: What kind of solution is the WindForce cooling system? What can consumers expect from the system?
A: Liquid cooling has always been considered to have better performance than air cooling in terms of heat dissipation; however, our latest WindForce 600W cooling module is already able to achieve a performance almost the same as a liquid cooling module.
The cooling module is able to dissipate heat generated from 600W of power consumption and has already been adopted onto our Nvidia Titan Black-based graphics cards.
With the cooling module's 600W heat dissipation rate, the graphics cards are able to operate at a constant low temperature even during heavy loads to allow stable output.
The module features many of Gigabyte's technologies such as our differing height fin design for the heat sink, Triangle Cool as well as a special fan designed to increase air flow. We have already acquired the patent for our Triangle Cool technology and are in the middle of acquiring others.
Q: How about PC peripheral products? What new features has Gigabyte integrated in them?
A: Gigabyte has been in the PC peripheral business for 6-7 years and we have designed many innovations for related products.
For Aorus, we are showcasing the new Aorus Thunder K7 keyboard and M7 mouse. The keyboard features a detachable number pad, which can be attached on either the left or right side of the keyboard.
The M7 is equipped with several thumb buttons, which are specially designed so users will not miss-click other buttons.
We will also showcase latest Gigabyte branded accessories at the show.
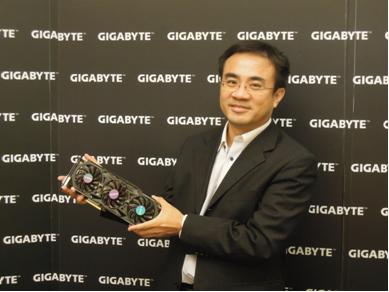
Eddie Lin, Associate VP of Gigabyte VGA business
Photo: Joe Tsai, Digitimes, June 2014

