

Gigabyte Technology has announced new AMD Radeon HD 7700 series graphics cards – GV-R777OC-1GD, GV-R777D5-1GD, and GV-R775OC-1GI – equipped with Gigabyte's latest in-house cooling solution and adapted with Gigabyte Ultra Durable 2 materials.
The Gigabyte Radeon HD 7700 series is equipped with a 10cm large fan to provide operate silently with noise levels only reaching 21.7-28dBA at full load.
Equipped with AMD Accelerated Parallel Processing (APP) technology, users can unleash the parallel processing power of GPU for physics, artificial intelligence, stream computing, ray tracing calculations, and tackle demanding tasks like video transcoding.
The Radeon HD 7700 Series offers full support for Microsoft DirectX 11. Gamers are able to enjoy their favorite games in full stereo 3D with AMD HD3D technology, which supports Stereo 3D display, gaming, and Blu-ray.
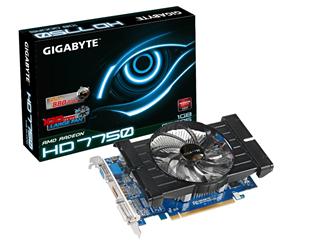
Gigabyte GV-R775OC-1GI graphics card
Photo: Company

