
The economy was harsh to the solar industry in 2011 as supply exceeds demand. In 2012, Taiwan-based solar cell firms still need to find a solution to prevent being marginalized.
2008 and 2011: Two dismal years
There were two hits to the solar industry, one in 2009 during the financial crisis and one in 2011 when demand suddenly froze.
In 2009, Taiwan's solar products with superior quality did not outperform others. Especially when China's solar firms began to flourish, the price of solar products started to drop rapidly, forcing Europe-, US-, and Taiwan-based firms to follow suit in price competition. Taiwan has not yet invested enough into the solar module and system segments, and therefore do not have the advantage of brand recognition like Europe-based firms do.
The solar industry rebounded quickly in 2010, only to see oversupply problem reappear as firms took on aggressive expansions. Demand froze suddenly due to changes made in the incentive programs in Europe. In second-quarter 2011, the oversupply pressure mounted.
Some firms in Greater China halted production after solar product prices dropped by 50% in 2011. Some Europe- and US-based solar firms declared bankruptcy.
Stable finances have helped Taiwan-based firms to survive the 2011 ordeal. China-based integrated solar firms have stopped issuing OEM orders to small- and medium-size firms causing the latter to halt production or closing plants. Despite the size of China-based integrated solar firms, some firms have been said to face difficulties obtaining financial capital, and need to reduce capacity.
The challenge in 2011 has forced Taiwan-based firms to face the reality that strong distribution channels are necessary. Taiwan-based solar cell makers have been working closely with Europe-based firms. But as the latter lose ability to compete with China-based peers, Taiwan-based firms have to suffer from decreasing orders. Solon declared bankruptcy while BP announced its exit of the solar market. These two firms have worked very closely with Taiwan-based solar firms.
Too far from end market
The weakness of Taiwan-based solar firms is that by only producing solar wafer and cells, the firms are distant from demand. This is hard for the firms to adjust inventory levels.
Taiwan-based firms have blind spots as far as the picture of demand is concerned because of its passive nature. So any cancellation of orders by customers would catch Taiwan-based firms by surprise.
Taiwan-based firms believe that by investing in the system end means securing distribution channels like their China-based peers have.
China's solar industry has been building distribution channels by allowing state-related financial institutes to provide funds for solar firms to invest in system projects around the world. It has been said that the surprising high level of installation in Europe in 2011 were due to China's large amount of investments.
Investing in systems is no panacea
Distribution channels are important, said industry sources, but another important segment is the finance side of solar PV projects. Solar firms need to acquire professionals that understand finance and the subsidy programs in various countries. This will prevent having financial capital stuck in a single segment.
The development of the system market can help solar firms to solve short-term sales problems, but in the long-run, liquidity may be a problem. Taiwan-based firms do not have sufficient capital sources like the China-based peers. It has been relatively easier for China-based solar firms to obtain funds because their government has been providing tremendous support through loans and tax breaks. This has caused the US government to initiate an anti-dumping and anti-subsidy investigation against China's solar industry.
Giant platforms do not promise vast growth
Having a strong large-size company backing the solar firms up has not yet shown significant benefits.
United Microelectronics Corporation (UMC) invested in thin-film solar product maker NexPower. Though NexPower is still the largest thin-film solar product maker in Taiwan, the rapid price fall of mainstream polysilicon solar products has been putting a lot of pressure on the thin-film solar industry.
Taiwan Semiconductor Manufacturing Company (TSMC) decided to invest in solar cell firm Motech in 2009. In 2010, TSMC began the development of CIGS thin-film solar products. With TSMC's support, Motech became the largest solar cell maker in Taiwan. However, Gintech, the second largest solar cell maker in Taiwan, is a strong competition with a comparable size.
Industry sources noted that product differentiation by technology improvements is less beneficial to solar firms than market segment differentiation. The reason is that differences in technology levels cannot shelter firms from price competitions.
This is apparent for industry leading thin-film solar firm First Solar. The firm has been eager to develop markets in Southeast Asia, the Middle East and other emerging economies. But the main market for solar PV products has always been Europe where demand for thin-film solar products is close to zero. The price competition and increasing demand for higher efficiency products in Europe simply is leaving little room for firms who make the more expensive thin-film products.
Other large-size Taiwan-based firms such as Delta Electronics, Lite-On, Inventec, AU Optronics (AUO) and Foxconn (Hon Hai) have been entering the solar market in different ways. But the expected positive effects have not yet shown.
Taking the China risks
Many solar firms in Taiwan have been relying on OEM orders from China-based peers. Taiwan's government also has been proud in the close relationship between enterprises from both sides. However, many solar firms have indicated that relying on OEM orders from China is tantamount to digging their own graves. The firms accept such orders because of the increasing difficulties in finding downstream customers and sufficient financial capital to continue operating. In addition, Taiwan's government has not been supportive of the industry.
Furthermore, it is hard for Taiwan-made solar products to differentiate from China-made products. In 2011, there were many OEM orders given to Taiwan from China-based firms because Taiwan firms have quality technologies. Also, China-based firms want to avoid risks in producing high-end products, and therefore have been transferring such risks to Taiwan-based peers.
The anti-dumping and anti-subsidy investigation taken up by the US government has been pushing China-based firms to give OEM orders to Taiwan-based peers. But China-based firms demand quotes based on China's domestic prices, which are considered too low for Taiwan-based firms.
The anti-dumping and anti-subsidy investigation may be benefiting Taiwan-based firms in some ways. However, some industry sources argue that Taiwan-based firms may thrive due to the investigation but in non-US markets, China-based firms still dominate. Hence Taiwan-based firms are just OEM factories for China.
Desperate for a new path
The solar market is a market closely related to government policies hence Taiwan's government should create an environment and strong support for the solar industry as Taiwan-based solar firms desperately find a market on its own instead of relying on OEM orders from China.
Taiwan-based solar firms need to find a new path to avoid being marginalized
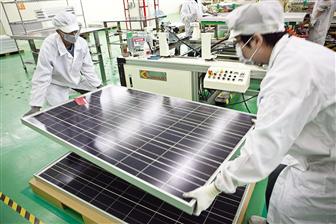
Photo: Digitimes file photo

