

With Computex just around the corner, Digitimes decided to pay a visit to Taiwan-based video specialist AVerMedia to see what the company has planned for this year's show. President Allan Yang was on hand to tell us his thoughts about the company's direction and future trends in the wider industry.
As Yang explained, AVerMedia has specialized in video technology since its inception in 1990. The company's early products focused on overlaying multiple analog video streams, but as video editing went digital, AVerMedia moved into video cross-conversion. AVerMedia's products enabled the conversion of PC VGA output to TV signals and vice versa, and sold strongly in the educational sector in particular.
AVerMedia's next step was to bring TV signals to the PC, allowing digital recording of TV content and helping customers to get the most out of their existing equipment, something that Yang says is central to the company's philosophy. AVerMedia now offers a wide range of peripherals focused on streaming home content across different devices, with particular emphasis on integrating HD, digital broadcasting and the Internet. As Yang puts it, "Video anytime, anywhere - that's where we're going."
Yang is unequivocal in his enthusiasm for HD video. "We believe high definition is the trend. Once you've used HD, it's hard to go back to SD. It's simply more persuasive, more immersive." While AVerMedia first moved into HD video capture 18 months ago, the company's lineup recently took an intriguing turn after its products proved a surprise hit in the gaming sector - a development that even Yang concedes took him "a little bit by surprise."
When they looked into the situation more closely, the AVerMedia team was amazed at the sheer quantity of games-related video online, with literally hundreds of thousands of clips uploaded to websites such as YouTube and China-based Tudou. Further research showed that the Xbox360 and PlayStation 3 have a collective user base of around 100 million people, an enormous potential market. While most games consoles feature HD quality graphics, the video capture market was largely limited to SD, with the HD sector served exclusively by expensive professional products costing upwards of US$1,000. AVerMedia aims to fill this niche with a range of budget HD capture devices for gamers, to be launched sometime between now and August. Products will include an external PC-based capture solution with editing functionality, which passes video from the console through to the TV so the gamer can play on without interruption from the capture process; an internal video capture card for DIY enthusiasts; and a standalone box that keeps HD capture simple for console players that don't want the hassle of using a PC. The greatest selling point of these products is likely to be their price tag of around US$200, which Mr Yang says AVerMedia selected because the existing capture solutions cost far more than the games consoles themselves. As the first manufacturer to address this sizeable niche market, AVerMedia expects to see strong sales.
AVerMedia also makes a line of more professionally-oriented video capture products known as DarkCrystal. DarkCrystal products are compatible with Adobe Premier Pro and include a full software development kit (SDK), allowing the development of dedicated apps for direct integration with other devices. Potential users include the medical industry, where a thriving market in HD capture is emerging as doctors find themselves under increasing pressure to justify and document every aspect of surgery, in order to avoid lawsuits.
One of the hot topics at Computex this year will be tablets, and Allan Yang is looking forward to showing off AVerMedia's latest efforts on this front, which are perhaps best represented by the company's HomeFree range of "standalone network tuners". The HomeFree range combines either an analog TV tuner and a digital (DVB-T) TV tuner, or a pair of DVB-T tuners, with Wi-Fi connectivity, allowing a tablet user to watch one TV source wirelessly while a PC or laptop user watches another. Add in the household TV and that should be enough to avoid most family arguments about what to watch! Windows is naturally supported, while Mac OS support will come in June. The tablet end is implemented via a special app that even allows the user to switch channels and browse digital TV content guides. The app is currently only available for the iPad, but Digitimes was given a sneak preview of a forthcoming Android app with similar features. The HomeFree Combo model also builds in the company's IR Blaster technology and AV-in support, allowing PC/laptop users to control a DVD player once the HomeFree Combo has been set up to emulate the DVD player's remote control.
Given the booming market for tablets and HD devices, Mr Yang is unsurprisingly upbeat about the prospects for AVerMedia and the video market in general. So what will AVerMedia be working on in the coming year? "Video is the key trend... along with networks and HD. Combining these to produce new products." With digital convergence, HD video and tablets all the topics of the moment, this year's Computex will provide a welcome opportunity for companies like AVerMedia to show what they can do in a sector where attention is too often focused solely on a handful of big name brands. If the products Digitimes has seen so far are anything to go by, Computex should prove to be an exciting affair for visitors and exhibitors alike.
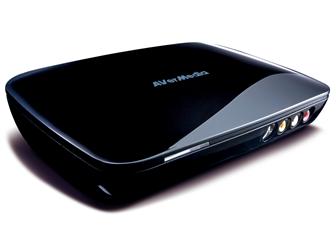
AVerMedia DarkCrystal HD Capture Station
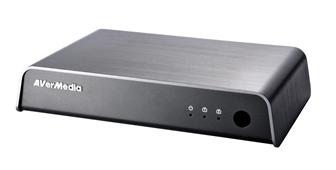
HomeFree Combo
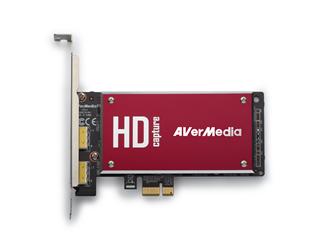
DarkCrystal HD Capture SDK II
Photos: Company

