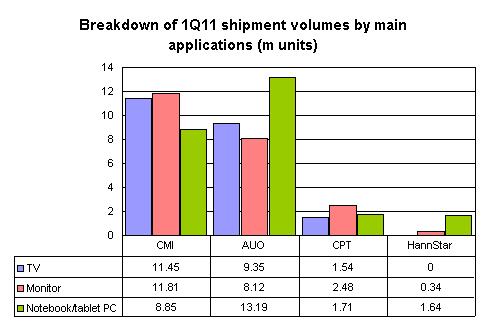
- AU Optronics
AU Optronics Corp. designs, develops, manufactures, assembles and markets flat panel displays. The Company's principal products are thin-film transistor-liquid crystal display (TFT-LCD) panels. AUO is able to offer TFT-LCD panels in sizes ranging from 1.2 inches to greater than 65 inches.
The company was established in September 2001 by the merger of Acer Display Technology, Inc. and Unipac Optoelectronics Corporation.
In October 2006, AUO further merged with Quanta Display Inc. to create a larger TFT-LCD manufacturer with 20% of the world's large-sized TFT-LCD market, forming the company as of today.
Its panels are used in computer products, such as notebook computers and desktop monitors; consumer electronics products, such as mobile phones, digital photo frames, digital still cameras, portable navigation display, portable digital video disc players, LCD televisions, and industrial displays.
The Company sells its panels primarily to original equipment manufacturing service providers or brand customers. The Company groups its business into three marketing channels: Information Technology Displays, Consumer Products Displays and Television Displays. AUO is the first TFT-LCD manufacturer in Taiwan to mass produce TFT-LCD panels by means of G3.5, G4, G5, G6,G7.5 and G8.5 fabrications, and the constructing G8.5 fab was enter mass production in the second half of 2009. In March 2008 and June 2008, the Company acquired 45% and 26% of equity interests in Verticil Electronic Corp. and Dazzo Technology Corporation, respectively.
-
Brief
Full name: AU Optronics
Chinese name: 友達光電股份有限公司
Short name: AUO
Arconym: AUO
Stock code: 2409
Country: Taiwan
Tax ID: 84149738
Market: TSE
Established: 12 Aug 1996
Paid in capital: NT$88.27 billion
Listed on TSE: 8 Sep 2000
Website: www.auo.com
Related news- AUO likely to turn around performance in 2013, says company chairman
- Innolux sees May revenues down, AUO hits 32-month high
- AUO aims at 20% market share for eTP touch panels for notebooks in 2013
- AUO to supply panels for use in 2nd-gen Nexus 7, say sources
- AUO publishes 65-inch Full HD OLED panel technology paper at SID Display Week
- AUO supply of iPad mini panels in 2Q13 expected to slip sequentially
- Innolux, AUO differ in strategies for tapping China smartphone panel market
- AUO reports April 2013 consolidated revenues
-
On display
-
Financial performance
AUO [2409] historical stock price (NT$) Date Volume (k) Transactions Value Open High Low Close Change Ask Bid 20-Jun 138,253 21,836 1,597,731,904 12.00 12.00 11.30 11.40 -0.75 -6.17% 11.45 11.40 19-Jun 44,114 8,603 539,876,509 12.30 12.40 12.10 12.15 -0.10 -0.82% 12.20 12.15 18-Jun 75,051 11,519 916,902,664 12.15 12.40 12.05 12.25 +0.10 +0.82% 12.30 12.25 17-Jun 49,049 7,540 600,280,560 12.20 12.40 12.15 12.15 -0.15 -1.22% 12.20 12.15 14-Jun 64,416 9,817 796,452,504 12.50 12.55 12.20 12.30 -0.10 -0.81% 12.35 12.30 13-Jun 62,895 10,236 790,253,341 12.80 12.80 12.40 12.40 -0.45 -3.50% 12.45 12.40 11-Jun 54,043 8,100 688,343,759 12.60 12.85 12.50 12.85 +0.20 +1.58% 12.85 12.80 - Source: TSE, compiled by Digitimes
AUO: Consolidated revenues, May 2012 - May 2013 (NT$m)
Month
Sales
M/M
Y/Y
YTD
Y/Y
May-13
38,300
3.5%
22%
169,548
18.7%
Apr-13
37,005
(2.4%)
21.9%
131,249
17.8%
Mar-13
37,917
36.7%
20.6%
94,244
16.2%
Feb-13
27,733
(3%)
(0.8%)
56,327
13.4%
Jan-13
28,595
(10.8%)
31.7%
28,595
31.7%
Dec-12
32,055
(5.4%)
15.7%
378,472
(0.3%)
Nov-12
33,901
1.4%
10.9%
346,417
(1.6%)
Oct-12
33,448
(7%)
7.2%
312,516
(2.8%)
Sep-12
35,955
2.4%
9.2%
279,068
(3.8%)
Aug-12
35,103
10.7%
5.5%
243,113
(5.5%)
Jul-12
31,719
(5.1%)
(3.1%)
208,009
(7.2%)
Jun-12
33,426
6.5%
6.9%
176,290
(7.8%)
May-12
31,402
3.4%
(6.6%)
142,864
(10.7%)
*Figures are consolidated
Source: TSE, compiled by Digitimes, June 2013AUO: Non-consolidated revenues, Dec 2011 - Dec 2012 (NT$m)
Month
Sales
M/M
Y/Y
YTD
Y/Y
Dec-12
30,664
(6%)
16.9%
362,995
1%
Nov-12
32,618
2.3%
13.4%
332,330
(0.3%)
Oct-12
31,885
(6.3%)
9%
299,712
(1.6%)
Sep-12
34,041
0.1%
9.2%
267,827
(2.7%)
Aug-12
34,019
11.8%
8.7%
233,786
(4.2%)
Jul-12
30,441
(6%)
(2.3%)
199,767
(6.1%)
Jun-12
32,398
7.3%
8%
169,326
(6.8%)
May-12
30,187
3.5%
(6.6%)
136,928
(9.7%)
Apr-12
29,169
(3.6%)
(6.2%)
106,741
(10.6%)
Mar-12
30,250
13.4%
(11.6%)
77,572
(12.1%)
Feb-12
26,669
29.1%
3.7%
47,321
(12.5%)
Jan-12
20,653
(21.3%)
(27.1%)
20,653
(27.1%)
Dec-11
26,234
(8.8%)
(6.8%)
359,528
(18.8%)
*Figures are not consolidated
Source: TSE, compiled by Digitimes, June 2013AUO: Consolidated revenues, 1Q12 - 1Q13 (NT$m)
Quarter
Sales
Q/Q
Y/Y
YTD
Y/Y
1Q-13
94,244
(5.2%)
16.2%
94,244
16.2%
4Q-12
99,400
(3.3%)
11.1%
378,471
(0.3%)
3Q-12
102,781
8%
3.9%
279,071
(3.8%)
2Q-12
95,189
17.4%
(2.9%)
176,290
(7.8%)
1Q-12
81,102
(9.4%)
(13%)
81,102
(13%)
*Figures are consolidated
Source: TSE, compiled by Digitimes, June 2013AUO: Non-consolidated revenues, 4Q11 - 4Q12 (NT$m)
Quarter
Sales
Q/Q
Y/Y
YTD
Y/Y
4Q-12
95,168
(3.4%)
13%
362,995
1%
3Q-12
98,501
7.4%
5.2%
267,827
(2.7%)
2Q-12
91,754
18.3%
(1.8%)
169,326
(6.8%)
1Q-12
77,572
(7.9%)
(12.1%)
77,572
(12.1%)
4Q-11
84,239
(10%)
(12.2%)
359,528
(18.8%)
*Figures are not consolidated
Source: TSE, compiled by Digitimes, June 2013AUO: Consolidated balance sheet, 4Q11 - 4Q12 (NT$k)
Item
4Q-2012
3Q-2012
2Q-2012
1Q-2012
4Q-2011
Current assets
175,736,039
190,826,687
204,267,662
204,795,794
202,673,929
Long-term investments
13,811,600
15,066,174
15,108,818
15,591,831
15,917,335
Intangible assets
14,932,898
14,912,668
15,109,661
15,274,779
15,428,102
Other assets
19,752,120
19,474,943
19,305,085
18,820,948
18,355,071
Assets
539,802,513
571,523,554
596,573,498
604,605,949
612,778,144
Current liabilities
191,594,322
193,808,008
192,501,060
191,759,456
204,179,867
Other liabilities
9,423,221
9,407,075
1,864,258
2,131,134
1,162,605
Liabilities
376,567,031
395,353,735
400,471,877
397,769,630
391,501,206
Stockholders' equity
163,235,482
176,169,819
196,101,621
206,836,319
221,276,938
*Figures are consolidated
Source: TSE, compiled by Digitimes, June 2013AUO: Non-consolidated balance sheet, 4Q11 - 4Q12 (NT$k)
Item
4Q-2012
3Q-2012
2Q-2012
1Q-2012
4Q-2011
Current assets
130,725,312
143,610,106
150,162,650
150,825,900
147,162,218
Long-term investments
69,403,377
70,516,048
73,935,228
74,750,079
76,817,592
Intangible assets
14,927,942
14,739,452
14,935,584
15,099,758
15,252,173
Other assets
16,130,256
15,564,737
15,386,720
14,504,971
14,369,624
Assets
448,414,195
471,039,261
491,900,747
504,656,634
513,413,741
Current liabilities
161,332,727
164,793,535
163,252,656
162,611,550
172,691,926
Other liabilities
9,133,864
9,119,776
1,588,294
1,849,054
856,270
Liabilities
299,263,340
309,217,538
313,466,847
314,101,491
308,025,025
Stockholders' equity
149,150,855
161,821,723
178,433,900
190,555,143
205,388,716
*Figures are not consolidated
Source: TSE, compiled by Digitimes, June 2013AUO: Consolidated income statement, 1Q12 - 1Q13 (NT$k)
Item
1Q-2013
4Q-2012
3Q-2012
2Q-2012
1Q-2012
NT$k
% of sales
NT$k
% of sales
NT$k
% of sales
NT$k
% of sales
NT$k
% of sales
Gross sales
95,303,878
100,592,689
103,244,844
95,678,355
81,445,926
Operating revenue
94,244,179
98.9%
99,400,223
98.8%
102,780,523
99.6%
95,188,539
99.5%
81,101,650
99.6%
Gross profit (loss) from operations
4,548,237
4.8%
2,821,840
2.8%
-1,861,882
-1.8%
-3,186,434
-3.3%
-6,448,561
-7.9%
Operating expenses
5,909,631
6.2%
7,584,231
7.5%
7,284,908
7.1%
7,283,582
7.6%
7,036,916
8.6%
Operating income (loss)
-1,361,394
-1.4%
-4,762,391
-4.7%
-9,146,790
-8.9%
-10,470,016
-10.9%
-13,485,477
-16.6%
Non-operating revenues and gains
-1,843,996
-1.9%
2,138,333
2.1%
1,376,800
1.3%
838,820
0.9%
1,837,606
2.3%
Income from continuing operations before income tax
-3,205,390
-3.4%
-13,079,989
-13%
-16,319,415
-15.8%
-11,841,934
-12.4%
-14,029,244
-17.2%
Net income (loss)
-3,319,641
-3.5%
-13,171,542
-13.1%
-16,479,023
-16%
-12,460,812
-13%
-13,795,627
-16.9%
Fully-diluted earnings per share (NT$)
-1.4
-1.9
-1.4
-1.5
*Figures are consolidated
Source: TSE, compiled by Digitimes, June 2013AUO: Non-consolidated income statement, 4Q11 - 4Q12 (NT$k)
Item
4Q-2012
3Q-2012
2Q-2012
1Q-2012
4Q-2011
NT$k
% of sales
NT$k
% of sales
NT$k
% of sales
NT$k
% of sales
NT$k
% of sales
Gross sales
96,371,131
98,892,850
92,225,450
77,820,165
84,934,602
Operating revenue
95,167,539
98.8%
98,501,148
99.6%
91,754,394
99.5%
77,571,501
99.7%
84,239,352
99.2%
Gross profit (loss) from operations
1,621,472
1.7%
-1,341,357
-1.4%
-2,960,198
-3.2%
-6,346,056
-8.2%
-10,376,521
-12.2%
Operating expenses
6,081,626
6.3%
5,761,238
5.8%
5,730,208
6.2%
5,488,106
7.1%
5,686,935
6.7%
Operating income (loss)
-4,460,154
-4.6%
-7,102,595
-7.2%
-8,690,406
-9.4%
-11,834,162
-15.2%
-16,063,456
-18.9%
Non-operating revenues and gains
1,609,864
1.7%
469,283
0.5%
594
0%
716,531
0.9%
597,688
0.7%
Income from continuing operations before income tax
-12,509,349
-13%
-16,274,607
-16.5%
-12,273,537
-13.3%
-14,043,832
-18%
-21,859,907
-25.7%
Net income (loss)
-12,462,505
-12.9%
-16,274,606
-16.5%
-12,273,539
-13.3%
-13,604,054
-17.5%
-20,675,479
-24.3%
Fully-diluted earnings per share (NT$)
-1.4
-1.9
-1.4
-1.5
-2.3
*Figures are not consolidated
Source: TSE, compiled by Digitimes, June 2013 - AU Optronics full profile
- Japan exports rise by most since 2010 (June 19) - BBC News
- IBM starts American job cuts, say reports (June 13) - NASDAQ.com
- NHK to air documentary on Taiwanese semiconductor giant (June 6) - Focus Taiwan news channel
- Slow global GDP growth weighs on IC market (May 29) - IC Insights
- Infineon ships security chips to Taiwan electronic passport program (May 23) - Company release
- Apple 'among largest tax avoiders in US' - Senate committee (May 21) - BBC News
- Weak eurozone growth hits euro (May 15) - The Financial Times
- German factory orders rise for second month (May 7) - Bloomberg
- Lose the switch, lose the loss: Cavendish Kinetics leverages MEMS for tunable RF components
- Cavendish Kinetics announces RF MEMS technology for improving wireless performance
- Solar trade dispute spreads to wine industry; gets personal
- Analogix eyes link between smartphones and HD displays
- Strong reaction from China, EU members over solar trade row
- LED business revenues to exceed NT$20 billion in 2013, says Lite-On Group chairman
- Pegatron expects 10% growth in 2Q13 shipments
- Windows RT facing pressure from being isolated
- Winbond, Macronix shipping NOR flash chips for Xbox One and PS4
- Taiwan market: HTC launches HTC Butterfly S and HTC Desire 600
- Formosa Epitaxy may see 3Q13 revenues grow 20-30% sequentially, says company chairman
- Digitimes Research: TSMC expanding in China
- Lite-On Technology to deal out 2012 cash dividend of NT$2.35
- Innolux not to be largely affected by subsidies ending in China, says company president
- Genius Electronic to expand lens capacity by 60%
- AUO likely to turn around performance in 2013, says company chairman
- DRAM market grows up, IHS finds
- Lite-On IT to start production of LED light bulbs in 3Q13
- Winbond looks to rising SDRAM prices in 2H13
- Large-size panel shipments grow 4% in May, says WitsView
- Blue filter glass in short supply due to white-box smartphone demand
- Emerging solar market growth dominates Solar Taiwan 2013 forum
- Accton obtains ODM orders with shipments scheduled until October
- Samsung sales of midrange large-size smartphones to affect China-based brands
- Prices of smartphone and tablet solutions to drop 10-20% in 2H13
- China market: Domestic TV panel supply falls far short of demand, says CVIA vice president
- Digitimes Research: South Korea firms mixed on solar business developments
- IC distributor WPG to see quarterly revenues exceed NT$100 billion in 2Q13
- Taiwan market: ViewSonic to launch Full HD projectors by end of 2013
- IDC lowers forecast growth for monitors while average screen size increases
- Releases
- White papers
- Bulletin
- Chilisin eyes strong prospect of tablet market, expects strong growth
- PowerByProxi aims to cooperate with Taiwan makers to explore wireless power market
- AZZURRO demonstrates high-yield production for GaN-on-Si voltage wafers
- Advantech Releases 6U CompactPCI Board with 4th Generation Intel Core i7 Processor
- Advantech to Support CompactPCI PlusIO and Serial Standards
- Embracing the New Generation Intel Atom Family with DDR3 Memory Support
- Got The Message? Ensuring efficient and reliable delivery of content across a mission critical digital signage network
- Emb' Store On-Demand Software Service for Embedded Computing
- Efficient Network Management for Digital Signage
- Design Benefits of the MI/O Extension Solution
20-Jun-2013 markets closed
| Last | Change |
| TAIEX (TSE) | 7898.91 | -108.48 | -1.35% |

| TSE electronic | 296.68 | -4.49 | -1.49% |

| GTSM (OTC) | 118.6 | -1.33 | -1.11% |

| OTC electronic | 142.43 | -1.93 | -1.34% |


Dialog Semiconductor has managed to land solution orders from first-tier smartphone vendors in the...

Lose the switch, lose the loss: Cavendish Kinetics leverages MEMS for tunable RF components
Cavendish Kinetics recently announced the availability of production samples of its tunable RF capacitors...

Taiwan-based Chimei Group, once a major LCD panel maker, now focuses on providing upstream components...

Eight years ago, the Metro Ethernet Forum (MEF) defined the first carrier class networks and services...
- Smartphone and tablet industry: The view from Taiwan - May 2012
Taiwan-based companies have a long and successful history of involvement in the supply chain for mobile devices, which for the purposes of this article consist...
- Taiwan motherboard industry overview - May 2012
The year 2011 saw the motherboard industry reverse its trend of declining shipments year-on-year, to post a slight 0.2% growth. This upturn in fortunes was expected...
- Notebook market overview - Jun 2011
The notebook industry in 2010 experienced several major events that significantly changed the industry's ecosystem for the year and the industry is also believed...
- LCD TV overview - Jun 2011
Growth of the global LCD TV market was not as strong as expected in 2010 as the market continued to feel the aftershocks of the economic recession that had hit...
- 2H 2012 global TFT panel market forecast
Digitimes Research predicts there will be a total of 389 million large-sized TFT LCD panels shipped in 2H12, with 195 million in the third quarter and 194 million in the fourth quarter - with the total representing a 7.6% increase over the first half of this year.
- Trends and shipment forecast for 2H 2012 smartphone market
Smartphone shipments in 2010 and 2011 both enjoyed growth of more than 60%. Growth will decelerate in 2012 due to the high base, as well as a slowdown in consumer spending in Western Europe.
- Trends in Asia LED chip manufacturing industry
Asia is playing an ever more important role in upstream LED chip manufacturing. The region accounted for 80% of MOCVD demand in 2011 and will account for 90% in 2012, largely because Taiwan, Japan, South Korea and China are the major global centers for LED chip production.


