
Toshiba has announced that it has enhanced its NAND flash portfolio with the introduction of 24nm generation "SmartNAND," which integrates error management into the NAND package. The new chips will support simplified host-side design and application of advanced NAND process generation in digital audio players, tablet PCs, information equipment, digital TVs, set-top boxes (STBs) and other consumer applications that require high-density, non-volatile memory.
Toshiba's new embedded NAND series is built using its 24nm process technology, and integrates a control chip supporting error correction code (ECC). Available in four to 64 gigabyte (GB) capacities, the devices are designed to remove the burden of ECC from the host processor while minimizing protocol changes. The SmartNAND portfolio is targeted for portable media players, tablet PCs and other consumer digital products.
The new 24nm product lineup will replace current 32nm generation devices, Toshiba said, adding that the advanced process combined with faster controller and internal interface will realize faster read and write speeds and enhance overall performance. SmartNAND also supports a range of read and write speeds, optimized to suit design objectives, and four read modes and two write modes will be offered.
Samples of the new SmartNAND lineup will be available from middle of April, and mass production will start in the second quarter of CY2011, according to Toshiba.
| Toshiba: 24nm generation SmartNAND portfolio | ||||
| Part number | Capacity | Package | Start of samples | Start of mass production |
| THGVR1G5D1HTA00 | 4GB | 48 pin TSOP | May | 2Q11 |
| THGVR1G5D1HLA09 | 52 land LGA | Aug | 3Q11 | |
| THGVR1G6D1GTA00 | 8GB | 48 pin TSOP | Apr | 2Q11 |
| THGVR1G6D1GLA09 | 52 land LGA | Jul | 3Q11 | |
| THGVR1G7D2GTA00 | 16GB | 48 pin TSOP | Sep | 4Q11 |
| THGVR1G7D2GLA09 | 52 land LGA | May | 2Q11 | |
| THGVR1G8D4GLA09 | 32GB | 52 land LGA | Jun | 3Q11 |
| THGVR1G9D8GLA09 | 64GB | 52 land LGA | Aug | 3Q11 |
Source: Company, compiled by Digitimes, April 2011
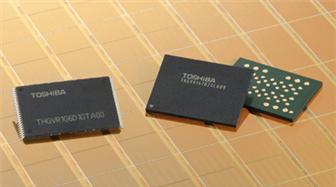
Toshiba SmartNAND
Photo: Company

