

Altek has unveiled the T8680 HD, an own-brand handset equipped with 12.2-megapixel camera, which will launch in the Taiwan market at a retail price of NT$10,900 (US$341) through retail chain Senao International on September 1, 2010, according to the company.
T8680 is an upgrade to the T8680 debuted in the China market in July 2009, with the new model adding 720p video recording functionality, Altek pointed out.
In addition, Altek is developing a 3G Android-platform smartphone with plans to launch it initially in Taiwan and China in the fourth quarter, the company indicated.
| T8680 HD specifications | ||
| Item | Detail | |
| Image sensor | 12.2-megapixel 1/2.33-inch CCD | |
| Zoom | 3x optical | |
| Screen | 3-inch WQVGA TFT-LCD touch | |
| Communication | Frequency band | GSM900/1800/1900MHz |
| Data | GPRS/EDGE Class 12, WAP 2.0 | |
| Dimensions (W × H × D, mm) | 52 × 113.5 × 16.5 | |
| Weight (net) | 135g | |
Source: Company, compiled by Digitimes, August 2010
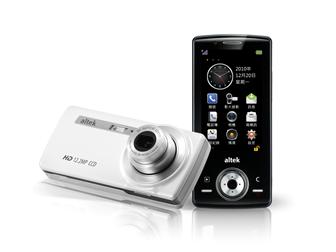
Altek T8680 HD cameraphone
Photo: Company

