

Aiptek International, a Taiwan-based maker of digital imaging devices for sale under the own brand Aiptek, on May 25 unveiled the i2, a pocket-size 3D HD digital video recorder for launch in July 2010. In the Taiwan market, retail price is recommended at NT$7,990 (US$250), according to the company.
Aiptek also unveiled a 3D digital photo frame, 3D digital album and 3D webcam.
The camcorder features a video recording resolution of 1280×720p, CMOS resolution of 5-megapixel for taking pictures, a dimension of 118×72×23mm and 2D/3D dual lenses, Aiptek pointed out.
With 70-80% of total revenues coming from DV sales currently, Aiptek expects the 3D lineup to account for 15% and 30% of total revenues in 2010 and 2011 respectively, the company noted.
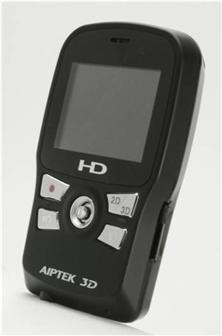
Aiptek i2 pocket-size 3D HD DV
Photo: Company

