

VIA Technologies has announced its Nano E-series processors, bringing native 64-bit software support, virtualization capabilities and extended longevity support to embedded markets.
The move to 64-bit software architecture is an essential transition for the future of the embedded industry, said VIA. Forthcoming operating systems such as Windows Embedded Standard 7 will be able to leverage a 64-bit software eco system that provides up to double the amount of data a CPU can process per clock cycle. This translates in to greater ease in manipulating large data sets and an overall performance boost compared to non-native x64 architectures.
The VIA Nano E-series also supports VIA VT virtualization technology, allowing legacy software and applications to be used in virtual scenarios without impacting performance. And as with all VIA processors, the VIA PadLock Security Engine offers hardware based data encryption standards that meet widely accepted international standards.
Available at speeds from 800MHz to 1.8GHz, VIA Nano E-series processors have a guaranteed product longevity of seven years, while the processors are fully compatible with a range of fully integrated media system processors including the VIA VX800, VIA VX855 and forthcoming VIA VX900 and VIA VN1000 digital media chipsets, offering exceptional hardware acceleration of the most demanding HD video codecs and 3D graphics capabilities.
| VIA Nano E-series processor specifications | |||
| Product model | Speed | VIA V4 FSB | Idle power |
| L3050 | 1.8GHz | 800MHz | 500mW |
| U3100 | 1.3+GHz | 800MHz | 100mW |
| U3300 | 1.2GHz | 800MHz | 100mW |
| U3500 | 1.0GHz | 800MHz | 100mW |
| U3400 | 800MHz | 800MHz | 100mW |
Source: Company, compiled by Digitimes, April 2010
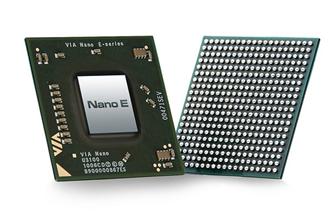
VIA Nano E-series processor
Photo: Company

