
VIA Technologies has announced Mobile-ITX, the latest VIA-developed open form factor specification for the creation of ultra-compact and portable embedded devices.
Mobile-ITX defines a compact 6×6cm computer-on-module specification designed to enable an easier and less resource intensive development cycle for a range of ultra-compact, portable embedded systems, VIA said.
Vertical market segments including medical, transportation and military embedded markets have evolved to demand higher miniaturization and portability from today's x86 platforms and VIA's Mobile-ITX form factor can offer a size 50% smaller than its Pico-ITX form factor, which measures 10×7.2cm, VIA said.
Mobile-ITX employs a modularized design that includes a CPU module card and an I/O carrier board. This offers greater flexibility for developers who can simply drop in the CPU module to a custom designed, application specific carrier board, negating lengthy developmental design and testing phases, VIA highlighted.
CPU modules based on the Mobile-ITX form factor integrate core CPU, chipset and memory functionality and I/O that includes CRT, DVP and TTL display support, HD Audio, IDE, USB 2.0, as well as PCI Express, SMBus, GPIO, LPC, SDIO and PS2 signals, through customizable baseboards. Mobile-ITX-based modules consume as little as 5W.
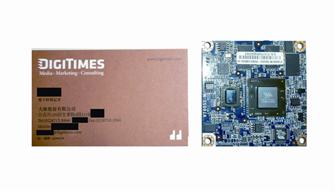
VIA Mobile ITX form factor-based motherboard compared to a business card
Photo: Ninelu Tu, Digitimes, December 2009

