

VIA Technologies has announced VB8003 mini-ITX motherboard featuring a dedicated on-board graphics processor that it says is ideal for a range of digital media applications.
The VB8003 utilizes the VIA VX800 MSP's integrated GPU to offer multi-display configurations including dual-HDMI, LVDS, DVI and VGA, while powering HD content playback across as many as four displays.
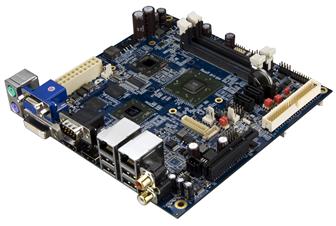
VIA VB8003 mini-ITX motherboard
Photo: Company

