
VIA Technologies has announced a new mobile computing device category, NetNote, that combines the company's Surfboard motherboard along with turnkey system design.
NetNote, a new market segment VIA hopes to create positioned between netbooks and traditional notebooks, combines the portability and affordability of a netbook with functionality and entertainment capabilities of a notebook in a light, high performance clamshell mobile device with long battery life, screen sizes between 10.2- to 12.1-inch, and support for playback of high bit-rate 1080p HD video, said VIA.
Combining the VIA VX855 media system processor with a choice of VIA C7-M ULV or VIA Nano processors, two new VIA Surfboard NetNote Edition platforms are available, enabling system designers the opportunity to create high-quality, energy-efficient and feature-rich solutions for manufacturing NetNote devices, said VIA.
Along with support for hardware acceleration of a variety of video standards including H.264, MPEG-2/4, VC-1 and WMV9, NetNotes come with features including an optional HDMI port and a choice of integrated 3G connectivity modules.
| VIA Surfboard NetNote turnkey platform specifications | ||
| Platform name | VIA VT6552 | VIA VT6549 |
| Processor | VIA C7-M ULV 800MHz FSB or VIA Nano 800MHz FSB | |
| Chipset | VIA VX855 Media System processor | |
| Display resolution |
Internal resolutions: up to 1366 x 768 pixels External resolutions: up to 1920 x 1440 pixels | |
| Graphics | VIA Chrome9 HCM IGP with memory share architecture, up to 512MB | |
| Memory support | One SO-DIMM socket, support DDR2 667/800 up to 2GB | |
| Audio codec | VIA Vinyl VT1702S | |
| Ethernet | VIA Rhine VT6107 10/100Mb | |
| Embedded controller | ITE8502E | |
| Card reader | Genesys GL827S | ITE IT1337E |
| PATA to SATA | Sunplus SPIF223B | Marvell 88SA8052-TBC2 |
| Clock generator | IDT ICS9UM701AKLF-T | |
| USB extension | USB hub (option) | |
| Battery | 24.4Wh(3S1P) / 10.8V (3.6V x 2.2AH x 3 cells) Default | |
| 48.8Wh (3S2P) /10.8V (3.6V x 2.2AH x 6 cells) | ||
| DC jack | AC 110~240V, DC 20V@40W | |
| Audio jack | Mic-In, HP-Out | |
| VGA output | D-sub VGA Output | |
| USB port | 2 ports | |
| LAN jack | RJ45 | |
| LVDS | Yes | Yes |
| Mini-PCIE | 2 sockets with USB interface only | |
| SIM card | Yes | Yes |
Sources: VIA, compiled by Digitimes, September 2009
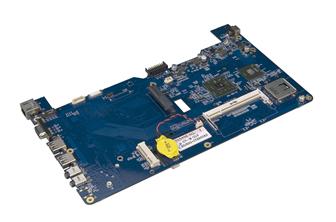
VIA Surfboard NetNote Turnkey platform
Photo: Company

