

Silicon Integrated System (SiS) has announced the SiS672/968/307DV chipset supporting Intel's Atom 230 CPU has being adopted by Lenovo to develop its IdeaCentre Q100 nettop.
The Q100 features a size of only 0.5-liter, and supports DDR2 667 memory up to 1GB.
The PC features the SiS Mirage 3 graphics engine to deliver 2D and 3D images.
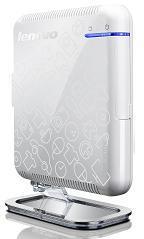
Lenovo IdeaCentre Q100 nettop
Photo: Company

