
Storage and networking solution provider LSI has launched a new generation of MegaRAID SATA+SAS RAID controller cards based on 6Gb/s SAS technology and announced its new channel strategy for worldwide customers.
Compared with 3Gb/s predecessors, the 6Gb/s SAS RAID-on-chip (ROC) system provides more video streams, more database transactions and faster backups, so the MegaRAID 9200 series controllers can double the data transfer rate and deliver up to 2.88 GB/s in sequential reads and 1.87 GB/s in sequential writes, the company claimed. The 9200 series controllers also provide channel customers with a low-cost upgrade that is designed to easily integrate with existing 3Gb/s SATA and SAS infrastructure, the company said.
The controllers also support both high-performance SAS hard drives and cost-effective, high-capacity SATA drives, as well as energy-efficient solid state drives (SSDs) and bring standardized zoning which improves storage efficiencies by allowing multiple servers to share storage devices. They come with four ports and eight ports to reach up to a storage capacity of 480 terabytes, indicated Suresh Panikar, senior manager of worldwide channel partner marketing and communications at LSI.
The new LSI MegaRAID controllers include five models - MegaRAID 9260-8i (eight internal ports), MegaRAID 9260-4i (four internal ports), MegaRAID 9280-8e (eight external ports), MegaRAID 9260DE-8i and MegaRAID 9280DE-8e. The 9260-8i is available now while the rest will be available by September.
In addition to the next-generation product, the company announced it has teamed up with channel partners include vertical OEMs (VOEMs), direct market resellers (DMRs), resellers, and distributors to service its customers worldwide. LSI also provides forward looking fundings to those channel partners quarterly in advance for them to have more sufficient resources in promoting and selling LSI products.
"LSI's strong channel partnerships are a key strategic advantage in the marketplace and central to the company's business strategy," said Phil Bullinger, executive vice president and general manager of the Engenio Storage Group at LSI. Panikar also expects this strong channel base to bring a lot more revenues to the company.
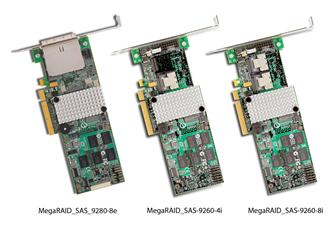
LSI MegaRAID controllers
Photo: Company

