

Acer America has extended its netbook line with two new models optimized for mobile customers – the 11.6-inch Acer Aspire One AO751h and the 10.1-inch Acer Aspire One AOD250.
The Aspire AO751h features an 11.6-inch high-definition LED-backlit widescreen (16:9 ratio) display, and although the netbook is thinner than previous generation netbooks, it still comes with all the same features, noted the company. The new devices use Intel Atom processors (N270 on the AOD250 and N270 or Z520 on the AO751h) and are equipped as standard with 1GB of memory and 160GB of hard drive space. Options of 2GB of DDR2 memory or up to a 250GB internal hard drive are also available.
The extended 6-cell battery for the AO751h can provide uptime of up to eight hours, while the 3-cell battery can provide four hours of uptime, according to Acer. Meanwhile, the AO250's standard 3-cell battery can provide up to three hours and 15 minutes of battery life, while the 6-cell battery can provide up to six hours.
| Acer's new Aspire One netbooks specifications | ||
| Model | A0751h-1192 | AOD250-1042 |
| CPU | Intel Atom Z520 | Intel Atom N270 |
| Display | 11.6-inch WXGA 16:9 ratio Acer CrystalBrite High Definition LED back-lit TFT LCD | 10.1-inch WSVGA 16:9 ratio Acer CrystalBrite LED back-lit TFT LCD |
| Chipset | Intel US15W Express | Mobile Intel 945GSE Express |
| Memory | Single-channel 1024MB DDR2 533MHz SDRAM | Single-channel 1024MB DDR2 533MHz SDRAM |
| GPU | Integrated Intel Graphics Media Accelerator 950 | Integrated Intel Graphics Media Accelerator 950 |
Sources: Company, compiled by Digitimes, May 2009
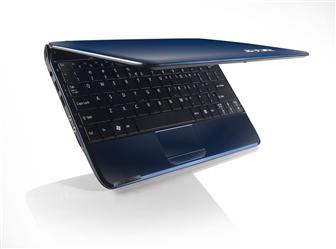
Acer Aspire One A0751h-1192 netbook
Photo: Company

