

Taiwan-based motherboard and notebook makers Gigabyte Technology and Elitegroup Computer Systems (ECS) as well as Singapore-based EMS firm Flextronics International have launched Intel-designed Montevina-based white-box notebooks for regional brand vendors around the globe, according to market sources.
The notebooks are launched under and Intel-led program, aiming to offer design support to second-tier OEM notebook makers to produce notebooks for brand vendors in different regions.
Intel's white-box notebook platforms include a 13.3-inch model (Bianca) and a 13.3-inch model (Peggy's Cove) featuring 3G capabilities, both made by Gigabyte, a 15.4-inch version of Peggy's Cove manufactured by Flextronics, and a 13.3-inch CULV-based ultra-thin notebook (Conte) made by ECS.
In addition to notebooks, a 8.9-inch white-box netbook (Elego) is being made by Amtek as part of the program.
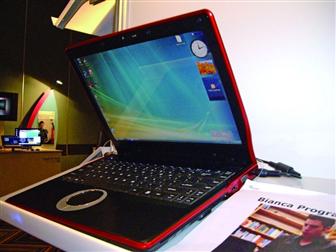
Intel's 13.3-inch Peggy's Cove white-box notebook made by Gigabyte
Photo: Monica Chen, Digitimes, April 2009
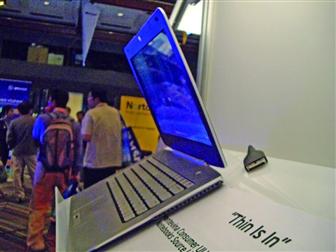
Intel Conte/T30 white-box ultra-thin notebook made by ECS
Photo: Monica Chen, Digitimes, April 2009

