
Taiwan-based TV card maker Avermedia has launched two new products – the AirExpress TV card and the TwinStar dual digital TV stick.
The AirExpress TV card is a 34mm ExpressCard interface with built-in remote control signal receiver, which supports standard TV, DVB-T and radio signals. The card also features a converter to support 54mm ExpressCard slots.
The TwinStar dual digital TV stick can receive two signals simultaneously. The TV stick also features a diversity mode to strengthen TV signals to improve reception quality.
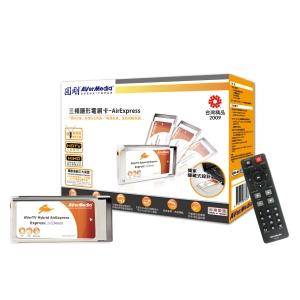
Avermedia AirExpress TV card
Photo: Company
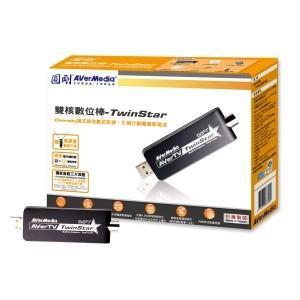
Avermedia TwinStar dual digital TV stick
Photo: Company

