

Albatron Technology has unveiled a new product, the Albatron GeForce 9500GT PCI-E 1X graphics card, to deliver multimedia performance to general consumers as well as for IPC clients looking to increase efficiency.
The card features Nvidia's GeForce 9500GT GPU and branded DDR3 memory.
The GeForce 9500GT PCIE-1X was designed for use in multi-display applications looking to maximize space.
| Albatron GeForce 9500GT PCI-E 1X graphics card specifications | |
| Item | Detail |
| Graphics Processor | GeForce 9500GT |
| Processor Cores | 32 |
| Graphics Clock | 550MHz |
| Processor Clock | 1375MHz |
| Memory Clock | 1400MHz |
| Memory size | 256MHz |
| Memory interface width | 128-bit |
| NVIDIA PureVideo | HD |
| NVIDIA Cuda | yes |
| NVIDIA PhysX | yes |
| Microsoft DirectX | 10 |
| OpenGL | 2.1 |
| HDMI | Via adapter |
| Audio input for HDMI | SPDIF |
| Bus support | PCIe 2.0 x1 |
| Max Digital resolution | 2560×1600 |
| Max VGA resolution | 2048×1536 |
Source: Company, compiled by Digitimes, March 2009
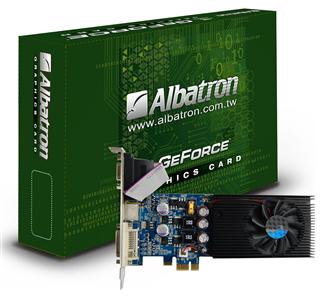
Albatron GeForce 9500GT PCI-E 1X graphics card
Photo: Company

