

Asustek Computer and Micro-Star International (MSI) plan to showcase their Intel consumer ultra low voltage (CULV) platform-based ultra-thin notebooks at CeBIT this year, according to sources at notebook vendors.
In addition to the company's X320 notebook, MSI will showcase two new X-Slim series notebooks - X340 and X600. The three notebooks adopt Intel's CULV platform, which consist of either the ultra low voltage version single-core Celeron, Core 2 Solo or dual-core Centrino 2 CPU.
Currently, Intel has about 20 different configurations for its CULV platform, with related systems from Hewlett-Packard (HP), Asustek and MSI scheduled to appear in the channel before June this year, the sources noted.
The sources also pointed out the slim profit from fierce competition in the 10-inch netbook segment, as well as the product's short life cycle should trigger several vendors to turn their focus to the entry-level ultra-thin notebook market.
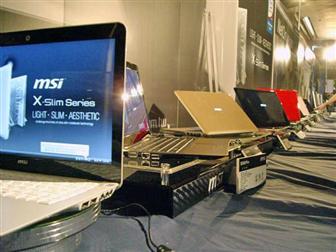
MSI CULV-based X-Slim notebooks include the X320, X340 and X600
Photo: Monica Chen, Digitimes, February 2009

