
Biostar Microtech International has announced TA760G M2+ and A760G M2+ motherboards powered by AMD's 760G IGP chipset.
The 760G paired with AMD's SB710 southbridge offers graphics performance based on AMD's ATI Radeon HD 3000 GPU.
| Biostar TA760G M2+ motherboard specifications | |
| Item | Detail |
| CPU | AMD Phenom/Athlon/Sempron processors |
| Chipset | AMD 760G |
| Memory | Dual-channel DDR2 1066/800/667/533 |
| GPU | Integrated ATI Radeon HD 3000 |
Source: Company, compiled by Digitimes, January 2009
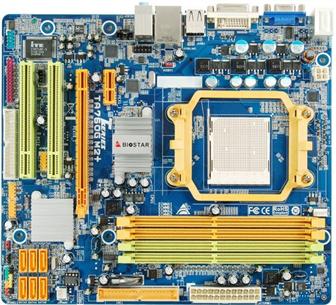
Biostar TA760G M2+ motherboard
Photo: Company

