

MSI has unveiled a dual-core nettop PC – the Wind NetTop D130, equipped with the Intel dual-core Atom 330 processor and 2GB DDR2 memory.
The Wind NetTop D130 features a built-in Super-Multi DVD burner and utilizes passive cooling to help reduce noise.
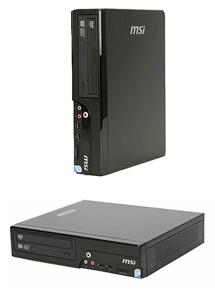
MSI Wind NetTop D130 nettop PC
Photo: Company

