

Lanner Electronics has released the FW-7872, a 1U half-rack network appliance for network security and acceleration applications.
Built around the Intel 945GME chipset, the FW-7872 provides Core 2 Duo and Celeron M support, up to 4GB of DDR2, four Gigabit Ethernet ports and two internal 2.5-inch drive bays. It also includes remote management features through IPMI and IP-KVM support, enabling administrators to monitor the system and perform maintenance tasks remotely, as well as hardware bypass and redundant power supplies, highlighted Lanner.
"The FW-7872's half-rack form factor achieves the same level of power and efficiency as a full 1U appliance but in half the space, leaving half of the rack space for additional hard drives, power supplies or another half-rack appliance." pointed out Jesse Chiang, Network Communications Product Planner at Lanner.
Lower power consumption and less heat generation round out the "green" aspects of the FW-7872, making the platform suitable for environment-conscious applications, said Lanner.
The Lanner FW-7872 is available for sample orders immediately.
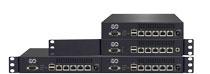
Lanner's FW-7872 network appliance
Photo: Company

