

At the recently concluded FPD International 2008 in Japan, one of the more interesting exhibitors was Samsung SDI, which was showcasing several new panel technologies at the show.
In the PDP segment, Samsung SDI was highlighting its 58-inch 3D PDP technology. Samsung SDI also indicated that its 50-, 58-, and 63-inch full HD PDP and 42- and 50-inch HD PDP can feature built-in 3D technology, as well as a refresh rate of 120Hz and a 3mm response time.
In the AMOLED segment, Samsung SDI exhibited a 40-inch AMOLED TV that the company claimed was the largest AMOLED TV worldwide. The company was also exhibiting AMOLED TVs sized at 31-inches and 14-inches. Samsung SDI also had a 6.5-inch flexible AMOLED panel and a 4-inch AMOLED panel with a thickness of only 0.05mm. The panel had WQVGA resolution, and 100,000:1 contrast ratio.
In addition, a transparent display which can be use as a window pane was also displayed by the company.
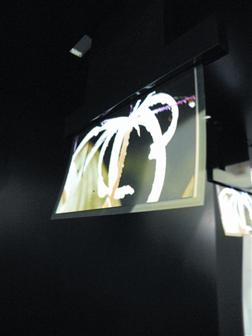
Samsung SDI's 40-inch AMOLED panel.
Photo: Max Wang
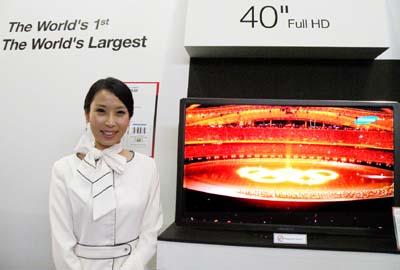
Samsung SDI's largest 40-inch AMOLED TV.
Photo: Max Wang.
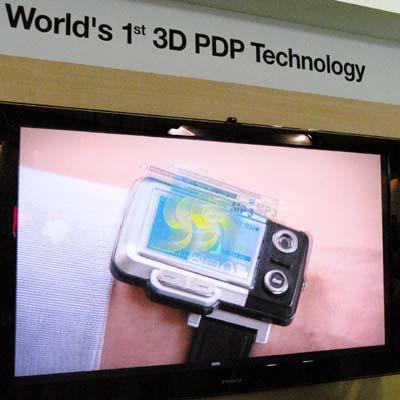
Samsung's 3D PDP Technology.Photo: Max Wang.
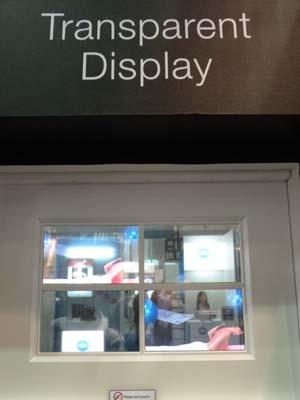
Samsung SDI's transparent display.
Photo: Max Wang.

