

AMD has introduced the ATI Radeon HD 4830 graphics card priced at less than US$150. Like all ATI Radeon HD 4800 series products, the new offering delivers excellent game performance and HD multimedia capabilities, as well as support for DirectX 10.1 games, highlighted the company.
ATI Radeon HD 4830 cards support ATI CrossFireX technology allowing gamers to combine up to four cards in one PC.
Card vendors Asustek Computer, Club 3D, Diamond Multimedia, Force3D, GeCube, Gigabyte Technology, Hightech Information Systems (HIS), Jetway, Micro-Star International (MSI), Palit Multimedia, PowerColor, Sapphire Technology and VisionTek are all expected to add the HD 4830 to their line ups, said AMD.
| AMD ATI Radeon HD 4830 GPU specifications | |
| Item | Detail |
| Video Memory | 512MB GDDR3 |
| Engine Clock | 575MHz |
| Memory Clock | 1800MHz (900MHz x2) |
| Memory Interface | 256-bit |
| DirectX Support | 10.1 |
| Bus Standard | PCIe 2.0 |
Source: Company, compiled by Digitimes, October 2008
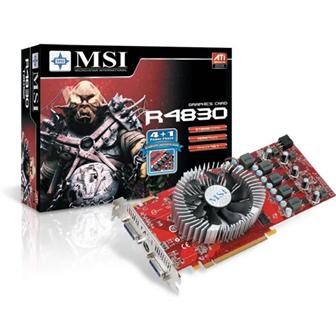
MSI R4830-T2D512 graphics card
Photo: Company
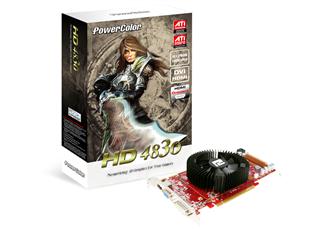
PowerColor AX4830 512MD3-H graphics card
Photo: Company

