
With the ever-increasing popularity of compact notebooks and high-end portable devices, demand for solid-state disks (SSD) is increasing and Transcend is at the forefront of market, offering a new high-speed range of SSD products this September with a fresh new look and double the read/write speeds of previous models.
Transcend's new notebook form-factor 2.5-inch SATA-II and IDE interface SSDs are both equipped with a tough but lightweight case, capacity up to 64GB, high reliability, low power consumption and resistance to shock and vibration.
Featuring a powerful new controller, Transcend's SSDs far outpace standard 2.5" hard drives, delivering exceptional sustained read/write speeds of up to 159MB/136MB combined with latencies below 1ms.
In addition, Transcend's SSDs have built-in ECC (Error Correction Code) that ensures highly reliable data transfer and increases overall system integrity.
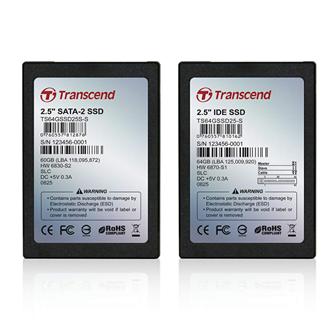
Transcend's new notebook form-factor 2.5-inch SATA-II and IDE interface SSDs
Photo: Company

