

AMD announced its latest high-end ATI Radeon HD 4870 X2, delivering 2.4 teraflops of processing power. Also announced today is the ATI Radeon HD 4850 X2 graphics card.
These cards comprise the ATI Radeon HD 4800 X2 series, combining two ATI Radeon HD 4800 series GPUs (graphics processing units) with a more advanced cross-GPU connection based on the PCIe 2.0 standard, plus two gigabytes of memory.
Based on an advanced 55nm design and DirectX 10.1 support, the ATI Radeon HD 4800 X2 series delivers engineering elegance and the industry's most compelling feature set. The ATI Radeon HD 4870 X2 is immediately available from vendors worldwide priced at US$549, while the ATI Radeon HD 4850 X2 is scheduled to be available in September at an estimated price of US$399.
The ATI Radeon HD 4800 X2 series provides support for ATI CrossFireX. Enthusiast gamers can now run the most demanding games smoothly in at the highest settings, enabling modes that were not playable before. With the efficient use of all four GPUs in a dual ATI Radeon HD 4870 X2 CrossFireX configuration, gamers will enjoy more than 3 times the performance of a single ATI Radeon HD 4870 card in many games.
The ATI Radeon HD 4870 X2 features 2GB ultra-high bandwidth GDDR5 memory and clocked at 750 MHz, with a combined 1600 stream processors.
Setting a new performance standard in graphics cards priced under US$400, the ATI Radeon HD 4850 X2 provides the power to play today's most demanding titles at ultra-high settings. The ATI Radeon HD 4850 X2 features 1600 stream processors, and two GPUs clocked at 625MHz. The ATI Radeon HD 4850 X2 features 2GB of GDDR3 memory.
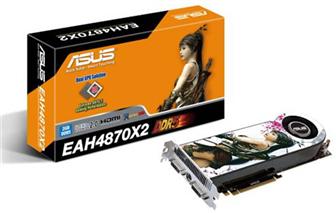
Asustek EAH4870X2 series graphics card with ATI Radeon HD 4870 X2 GPU
Photo: Company
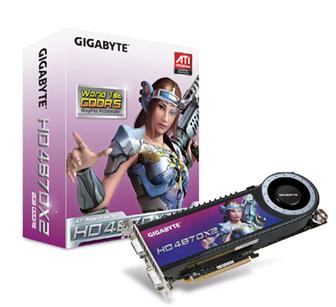
Gigabyte GV-R487X2-2GH-B graphics card powered by ATI Radeon HD 4870 X2 GPU
Photo: Company
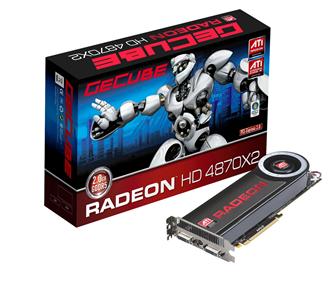
GeCube GC-HD4870X2-G3 graphics card with ATI Radeon HD 4870 X2 GPU
Photo: Company

