

Computex 2008 opened bigger this year with the inclusion of the Nangang Exhibition Hall to the venue. Fortunately, those interested in the latest and greatest handsets from many Taiwan-based handset vendors don't have to trudge all the way out to the new exhibition hall to catch a glimpse of the latest handsets that will be coming to the market in the next few months.
Starting in the Taipei International Convention Center (TICC) at booth T101B, one can get a glimpse of the handset goodies that Asustek has lined up. Though crammed in among the motherboards and gaming systems the company is displaying, you can still find some wiggle room to try out the handsets that Asustek will be releasing in the next few months.
Asustek's upcoming handsets on display target the higher end of the handset market. The M930, ZX1 and P560 are all scheduled to be released in the third quarter of this year, according to a company representative.
The M930 is unique in that instead of sliding to reveal its QWERTY keyboard, the device flips open sideways like an eyeglass case. The Windows Mobile 6 device supports EDGE/GSM and HSDPA connectivity and features a 2.8-inch main display screen and 2-megapixel camera.
Asus created a stir when it released its Lamborghini notebook PC in early 2006 and the company has carried the branding over into its handset lineup with the ZX1 Lamborghini. The 3.5G phone is powered by Windows Mobile 6.1 Professional and sports a 450MHz processor, touch screen interface, Wi-Fi connectivity and a 3-megapixel camera. The handset also has GPS functionality. True to its notebook brethren, the ZX1 sports a carbon fiber look on its casing.
Heading across the street to Hall 1 of the Taipei World Trade Center, you'll find a convenient cluster of handset vendors displaying their wares.
Mio Technology has a fairly large display this year at booth A626. Here you can play with the company's recently announced Leap K1 GPS handset. While many smartphones are using the Windows Mobile operating system, the K1 takes a different approach by using Windows CE 5.0. In another twist, the K1 features displays on both sides of the phone, a 2.6-TFT touch screen for PDA functionality and a 1.69-inch TFT OLED screen for phone mode. The GSM tri-band phone also has a 2-megapixel camera.
Just next to the K1, is the Leap G50. The Windows Mobile 6.1 powered GPS handset is a GSM quad-band device, also with a 2-megapixel camera. Both the K1 and G50 are scheduled to be released soon, first in Taiwan, according to a company representative.
Another interesting newly announced product at the Mio booth is the Moov 380. The GPS car navigation device has a built-in SIM card slot for GPRS connectivity and sports mobile phone functions. Not only can you enter terms or places to search for on the 4.3-inch touch screen, you can also make phone calls like you would on your mobile phone. The device is relatively light and thin (129×79×12.3mm) and is fairly responsive to input commands. Mio says that the Moov 380 will first launch in Taiwan in June and will be launched in other regions in the third quarter.
Heading east from Mio's booth towards behind the glass elevators of Hall 1, you'll find the friendly folks of E-Ten displaying their goods at booth D010. There is little chance of having to wait in line to play around with a cool gadget at this booth since E-Ten has laid out a large number of their upcoming or recently released handsets for people to try out.
Foremost among the company's offerings on display is the Glofiish V900. Featuring mobile TV reception, GPS functionality, a 3-megapixel camera, Wi-Fi connectivity and a nice big bright 2.8-inch VGA touch screen, the GSM/EDGE quad band/HSDPA phone is definitely on the high-end of E-Ten's product offering. The Windows Mobile 6.1 Professional device is planned to be released first in Italy around September at a price ranging between US$800-900, according to an E-Ten representative.
Something a bit different is the DX900, one of the first Windows Mobile devices to support dual-SIM cards. This feature opens up several interesting possibilities that could make life easier for users. Some examples E-Ten suggests include travelers can keep their home SIM card active to receive important calls, while at the same time using a local SIM card to avoid expensive roaming costs. Another possibility could be having one SIM card for cheap voice calls, and another for cheap data usage. The DX900 shares similar specifications to the V900 – VGA screen, GSM/EDGE and 3.5G/HSDPA – and should cost around US$800-900 when it becomes available early in fourth quarter.
For customers who like the look and specifications of the DX900 but don't need the dual-SIM feature, E-Ten will be offering the X900 starting in August for US$700-800.
Moving on down the price scale, is E-Ten's Glofiish X610. The GSM/EDGE quad band device is also powered by Windows Mobile 6.1 Professional and has built-in GPS and Wi-Fi connectivity. The camera of the X610, however, is only 2-megapixel in resolution. The X610 is planned to be released worldwide in July for around US$650, noted the representative.
Similar to Computex last year, if your time is short but you really want to see a lot of mobile phones, then Microsoft's exhibit in Hall 3 booth G236 is the place to go to. Here, a number of handset vendors, using Microsoft's Windows Mobile or CE operating system are displaying their goods. Besides Asustek, Mio and E-Ten, you'll also find Gigabyte Communications showing off its line of mobile TV capable handsets here.
Though all of the handsets that Gigabyte is displaying can receive mobile TV broadcasts, you unfortunately can't experience watching TV at the booth because of a lack of reception inside the exhibition hall, so said a Gigabyte representative. Gigabyte's MS820 3.5G handset is slated for release worldwide in August or October as is the MS808. The MS802 is scheduled for an earlier release in July, noted the representative.
Perhaps the biggest shining star among Taiwan-based handset vendors is High Tech Computer (HTC) and you can see the company's latest offerings at the Microsoft booth too. The handset vendor started out as a contract manufacturer for major international vendors but in recent years the company has made a name of itself under its own brand name.
HTC has most of its entire handset line up displayed at the Microsoft booth. The company's entire line of Touch handsets can be fiddled with, including the recently announced Touch Diamond.
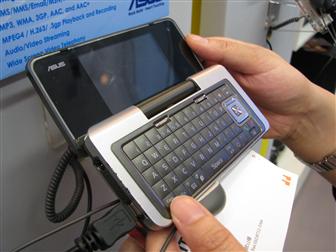
Asustek M930 Windows Mobile handset
Photo: Eric Mah, Digitimes, June 2008
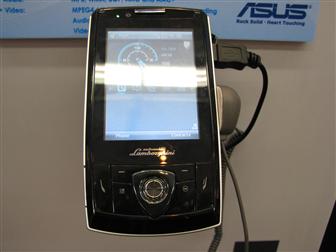
Asustek ZX1 Lamborghini handset
Photo: Eric Mah, Digitimes, June 2008
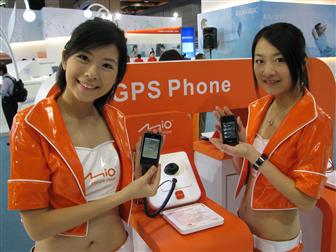
Mio Leap K1 and Leap G50 GPS handsets
Photo: Eric Mah, Digitimes, June 2008
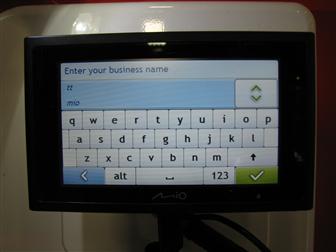
Mio Moov 380 GPS navigation device with built-in SIM card slot
Photo: Eric Mah, Digitimes, June 2008
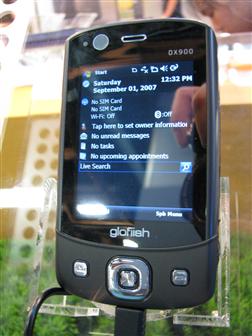
E-Ten Glofiish DX900 dual-SIM card handset
Photo: Eric Mah, Digitimes, June 2008
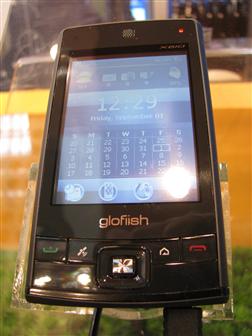
E-Ten Glofiish X610 handset
Photo: Eric Mah, Digitimes, June 2008
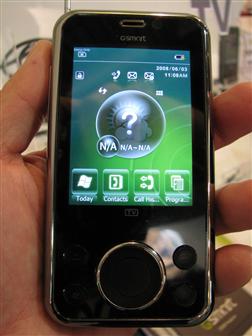
Gigabyte Communications MS808 mobile TV capable handset
Photo: Eric Mah, Digitimes, June 2008
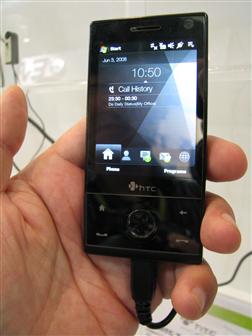
HTC Touch Diamond
Photo: Eric Mah, Digitimes, June 2008

