

Leadtek Research is presenting its latest products in line with its "Digital Life" theme at Computex Taipei 2008. Products on display include the company's latest graphics cards, TV tuners, GPS location trackers, security monitoring devices and infant care devices.
Leadtek's WinFast PalmTop DTV200 H is a palm-size device with USB2.0 plug and play interface that allows for not only high performance TV and radio reception on a notebook PC, but also input video from a VCR, camcorder or even video game consoles. In addition, with new de-interlacing technology, the WinFast PalmTop DTV200 H offers perfect quality video without flickering. The PalmTop DTV200 H supports HDTV and Dolby Digital AC3 audio, allowing the transformation of a notebook into a multifunctional multimedia center.
Also on display at Computex is Leadtek's LR8M03 LBS tracker, a small and powerful GPS/GSM/GPRS tracking device developed for personal remote positioning and emergency reporting. The LR8M03 is equipped with a 20 channel SiRF-Star III LP GPS chip and is suitable for applications such as vehicle security, monitoring the position of an injured person or whereabouts of a pet. The device can transmit longitude and latitude coordinates not only to a cell phone by SMS, but also to a PC through a GPRS Internet connection, which can then display the location with dedicated map software.
Leadtek's Network CarePhone NCP3680 is an ergonomic, compact and simple-use network-based home security and home surveillance camera equipped with MPEG-4/H.263 duo video and G.711/G.729 duo audio compression technologies. The device can also double up as a door security system, replacing the door bell and acting as a visitor video answering machine. Even more, it can also be programmed as a home care camera for families and patients.
Leadtek's Health Baby is a single-lead ECG and body temperature recorder. The device is designed for long distance medical care and self-monitoring. Health Baby has an easy-to-use interface and doesn't require any cable connection during monitoring. Users simply place the device on their chest or put two thumbs on the electrodes and push a button to start recording. Recorded data can be transmitted via a USB cable to a PC or mobile phone, and forwarded to a health management center through the Internet for advanced daily monitoring.
Leadtek is also displaying its WinFast PX9800 GTX graphics card at Computex 2008. The PX9800 GTX has 512MB of GDDR3 memory and features the Nvidia GeForce 9800 GTX graphics processor. The PX9800 GTX runs at 675MHz and supports Microsoft DirectX 10 with full Shader Model 4.0 support and 3-way SLI technology.
Leadtek is also featuring its WinFast PX9600 GSO Extreme graphics card. Based on the Nvidia GeForce 9600 GSO core chip, the PX9600 GSO is equipped with 384MB of GDDR3 on a 192-bit memory bus design and 96 stream processing units, which makes overclocking performance easy.
The graphics card also uses Leadtek's exclusive S-fanpipe cooler. The innovative cooling system can effectively conduct GPU heat through an S-shape copper heat pipe to the fan for a dramatic cool down effect.
Leadtek can be found at the TWTC Hall 1 in booths A926 to A1031.
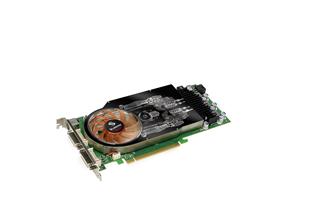
Leadtek WinFast PX9600 GSO Extreme graphics card
Photo: Company

