

What quickly becomes clear as you walk among the various booths of Taiwan's motherboard and graphics card makers at this year's Computex is that the main attraction is boards based on Intel's new 4-series chipsets. With practically everyone offering the same basic lines – G43 for the low-end, G45 and P45 for mid-range, and X48 for the high-end – each vendor is trying to find a unique way to make its products and booth stand out among the many others in the Nangang exhibition hall.
Gigabyte is demoing a range of motherboards which are targeted at overclockers, including a pair of "Extreme" models sporting the company's extravagant Hybrid Silent Pipe cooling solution. A Gigabyte representative said the company has listened to feedback from professional overclockers, reviewers and its customers and rolled several unique features into its boards specifically aimed at enthusiasts, including the ability to tweak voltage increments by as little as 0.002V and onboard power and reset switches for when the boards are set up on a test bench.
On some new mid-range Gigabyte motherboards, system builders will now find Diagnostic LEDs scattered around the board that can help pin-point the source of a hardware issue, for example, incorrectly inserted RAM when putting together a new system, while high-end boards include the company's Debug LEDs system which goes even further in helping to resolve problems.
In addition to showing off its Dynamic Energy Saver (DES) technology which can be found on the majority of the company's motherboards, Gigabyte is also introducing TPM-based security on select models which is particularly useful to users who want to secure their data using encryption such as Windows BitLocker. The company is highlighting another new feature called Smart Backup on some motherboards, which consists of a RAID controller chip from Silicon Image that allows hardware-based, operating system independent (no need for drivers) support for RAID 0 or 1. Gigabyte seems to be a pioneer of this feature and it is, in our opinion, one of the more interesting developments at Gigabyte's booth, if not all the motherboard booths.
Over at the booth of Micro-Star International (MSI), you will find another host of Intel 4-series motherboards. MSI is also highlighting is own DrMOS energy-saving technology, but at the moment this solution is not as sophisticated as Gigabyte's DES.
However, one stand out product at the booth of MSI is the P4S8D, a DRR2/DDR3 "hybrid" motherboard with a total of eight memory slots (four DDR2/four DDR3). Models like this usually appeal to cost-conscious enthusiast as they let you build a system using cheap DDR2 memory now, while making it possible to upgrade to DRR3 when prices come down. However, boards in the past have only supported up to six slots (four DDR2/two DDR3) meaning users had to compromise a little.
Foxconn (Hon Hai Precision Industry) continues to try and promote itself as an enthusiast brand and is hosting live demonstrations at its booth with professional overclockers trying to push the company's Quantum Force series motherboards as far they can, with a little help from liquid nitrogen (LN2). Meanwhile, Elitegroup Computer Systems (ECS) is also trying to break back into the high-end segment with its Black and Black-Extreme series.
More Intel 4-series boards and products can be found at the booths of Albatron, Abit, Biostar International and Shuttle. To see something slightly different, however, you need to head over to Zotac where the company is showing a complete range of Nvidia chipset-based motherboards, including the high-end nForce 790i-Supreme.
Among all the traditional motherboards are scattered a couple of Atom-based boards for people hoping to build their own systems like the Eee Box and Wind PC. Gigabyte has one but says it will not be available in the channel, MSI has one also. ECS has two, including one based on the AMD-founded DTX form factor rather than the usual mini-ITX, while Foxconn also has several versions, some offering a mini PCI slot rather than the typical full size PCI. According to an ECS representative, the company expects to start offering these products in the next few months priced around US$50-60.
To take a look at the booth of Taiwan's other top motherboard maker, Asustek Computer, you have to leave the Nangang exhibition hall and take a shuttle bus to the Taipei International Convention Center (TICC). There you will find yet more Intel 4-series, motherboards, another take on energy saving technology – Energy Processing Unit (EPU), and more motherboards that encourage you to tweak every last drop of performance out of them. That isn't to say Asustek's lineup isn't strong, it's just the 30-minute journey is a long way to go to see more of the same.
However, what does make the trip worthwhile is the opportunity to take a look at the new 10-inch Eee PC and the Eee Box, as well as the Eee Stick GMC, a motion control device similar to the Nintendo Wiimote, which looks like it could become a more natural way to control your PC or play games, turning the Eee Box into a family room entertainment system.
Finally, Asustek is showing some concept devices, including a notebook that has two touch screen displays. The demo shows how you can interact with the system using touch and gestures with the displays changing to suit different activities, e.g. showing a traditional-looking soft-keyboard and track-pad when editing documents. With Microsoft recently revealing that Windows 7 will place a large emphasis on touch-based controls, this prototype could be a design that is quite common within just a few years.
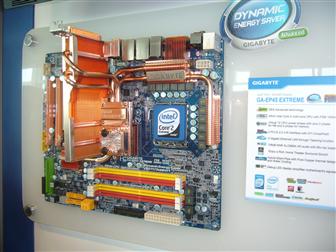
Gigabyte's Hybrid Silent Pipe can be found on its Extreme series motherboards
Photo: Ricky Morris, Digitimes, June 2008
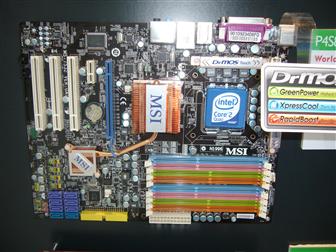
MSI's P4S8D has a total of eight memory slots
Photo: Ricky Morris, Digitimes, June 2008
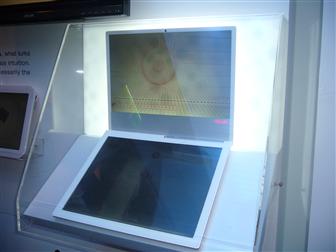
Asustek's concept notebook with two touch screens
Photo: Ricky Morris, Digitimes, June 2008

