

Mio, a subsidiary of Mitac International, launched two GPS phones and a GPS navigation device at Computex 2008.
Mio launched its Leap K1, a dual-sided GPS navigation phone with a dual side display, at Computex 2008. One side of the device is a feature phone with an easy to use interface, while the other side is a fully-functioning flat panel navigation system. Users can switch between functions by pressing a button, according to the company. The Leap K1 features MioMap 2008, dual navigation modes a built-in camera and Bluetooth and runs on the Windows CE 5.0 operating system.
Mio also announced its Leap G50 navigation phone, which features the functionality of a GPS navigation system, camera and PDA phone. The Leap G50 runs on Windows Mobile 6.1.
Both phones will be launched in Asia in the third quarter, according to the company.
In addition to handsets, Mio also announced the launch of its Moov 380 PND, which features built-in SIM card support for full phone features and GPRS connectivity. The company also introduced a concept GPS camera product at Computex.
Mitac expects to ship 9.5-10 million units for all types of its GPS devices in 2008, including shipments on an ODM/OEM basis, according to a report in the Chinese-language Economic Daily News (EDN).
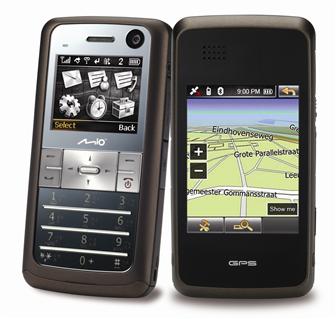
Mio Leap K1 GPS handset
Photo: Company
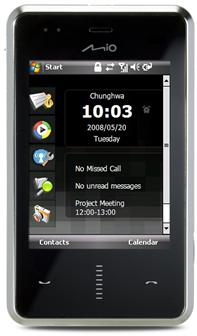
Mio Leap G50 GPS handset
Photo: Company
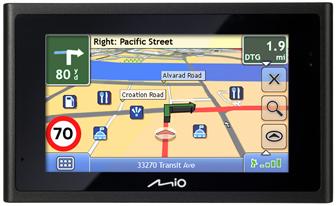
Mio Moov 380 PND with built-in SIM card support
Photo: Company

