

Shuttle, a leading designer and manufacturer of small form factor (SFF) computers and accessories has expanded its line of mini PCs with the introduction of classic XPCs, simple-and-smart KPCs and all-in-one digital home appliances.
With the long-term success of the XPC product line, Shuttle has been continuously devoted to innovation. The XPC Prima series SX48P2 E and SX48P2 Deluxe feature Intel's latest high-end X48 Express chipset, supporting up to 8GB of memory. Featuring ATI CrossFireX technology, the Shuttle SX48P2 E and SX48P2 Deluxe provide the flexibility to ramp up performance to meet versatile computing demands from video editing to gaming.
HD audio effects are also brought to users by 7.1-channel Dolby Digital Live! and DTS Connect. Shuttle technologies such as Speed-Link technology for fast and easy data transfer between two PCs, all solid capacitor designed motherboards and 802.11 b+g wireless LAN and Bluetooth 2.0 are included in the SX48P2 Deluxe.
In the Shuttle Glamor series, a silver stripe and mirror band embellish the chassis. The Glamor SN78SH7 features Nvidia's latest GeForce 8200 chipset and supports the newest AMD Phenom X4 quad-core processors, bringing high-definition graphics quality, lower power consumption and fantastic system performance. Shuttle's new SG45H7 offers multimedia entertainment for players seeking to push the limits of graphic performance.
The Glamor Series is a quiet platform which produces less than 30dBs when running heavy software loads.
The Korporate Perfect Cube (KPC) series provides solutions to simple-task users in the home and corporate market. Following the success of the KPC-K45 launched early this year, Shuttle is now presenting the newest KPC-K48 and K58, targeting home users who require only simple PC functionality in a second PC for the home. Also, Shuttle's unique changeable front panel "MyKover" can be customized to fit each user's personal style.
The K48 allows accessing the Internet and enjoying multimedia entertainment at an affordable price. The KPC lineup consumes very little power and is cost effective. When in full-use mode, power consumption is only 55W and 30W when in idle mode. All components are RoHS compliant. The KPC K48 is shipped as a bare-bone PC while the K58 is shipped as a system equipped with Intel Atom processors.
The Shuttle D-series D10 is a digital home appliance. The D-series is designed as a standalone media center delivering a complete digital entertainment with a touch screen or a remote control. The D10 comes with an embedded 7-inch touch panel. Users no longer need to rely on a keyboard and mouse to operate the D10 to still enjoy the functionality of a PC. Based on the same hardware and using surveillance software and equipment, the D10 can be utilized for surveillance purposes as a convenient way to secure your home. The D-series can run Linux or Windows operating systems.
Shuttle can be found at booth numbers M511, M512, M517 and M518 in the TWTC Nangang Exhibition Hall.
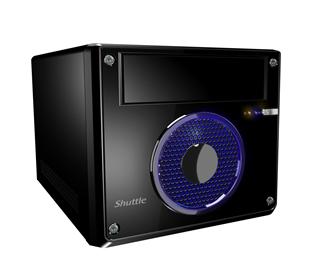
Shuttle K48
Photo: Company
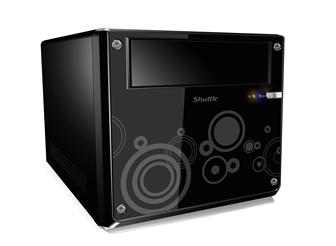
Shuttle K58
Photo: Company

