The overview you are trying to open requires news subscription. Please sign in if you wish to continue.
 Taiwan's success in the motherboard sector has followed the development of Taiwan's IT industry and the explosion in PC use worldwide.
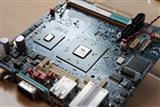
Table of contents