

News subscription required to download the report. Please sign in if you wish to continue.
Global economic turmoil has seriously impacted growth in the PC market and it will remain weak (2Q-3Q) leading up to the launch of Windows 8, whose initial benefit will mainly be satisfying delayed demand from the third quarter. For the year, global shipments will reach 207 million, a growth rate of only 2.1% from 2011. Lenovo, Asustek Computer, Apple and Samsung will all achieve a strong performance to help them gain market share in the second half of the year, while HP and Dell will face a decline with Acer expected to maintain its ranking.
Abstract
Global economic turmoil has seriously impacted growth in the PC market and it will remain weak (2Q-3Q) leading up to the launch of Windows 8, whose initial benefit will mainly be satisfying delayed demand from the third quarter. For the year, global shipments will reach 207 million, a growth rate of only 2.1% from 2011. The breakdown in notebook shipments between the first and second half of the year will be in a ratio of 47:53.
Notebooks with special form factors are still waiting for a breakthrough opportunity. For example, the penetration rate of ultrabooks is estimated to account for less than 5% of global notebook shipments in the fourth quarter, while notebooks with touchscreen control as well as models with a special form factor are both expected to account for less than 1%.
Notebooks that adopt a solid state drive (SSD) will account for 7.1% of total shipments in the fourth quarter, but around 70% of those shipments will be contributed by Apple products.
In the second half of the year, among notebook ODMs, only Quanta Computer and Compal Electronics will have a strong chance to achieve further growth. In terms of brand vendors, Lenovo, Asustek Computer, Apple and Samsung will all achieve a strong performance to help them gain market share, while HP and Dell will face a decline with Acer expected to maintain its ranking.
Table of contents
Chart 5: Global notebook shipments and growth in 1H12 (k units)
Chart 6: Global notebook shipment growth by product type, 1Q10-2Q12
Chart 7: Major events that will affect notebook shipments in 2H12
Chart 8: Global quarterly notebook shipments, 1Q11-4Q12, (k units)
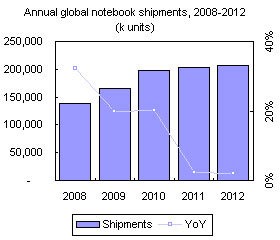
Chart 9: Annual global notebook shipments, 2008-2012 (k units)
Chart 10: Global notebook shipment proportion by quarter, 2009-2012
Chart 11: Global quarterly netbook shipments, 1Q11-4Q12 (k units)
Chart 12: Ultrabook and SSD-based MacBook shipments, (k units)
Chart 14: Outlook of SSD-based notebook shipments, 4Q11-4Q12 (units)
Chart 15: Transformable notebook shipment forecast scenerios (k units)
Chart 17: Touchscreen notebook outlook, shipments and share (k units)
Chart 18: Touchscreen notebook shipment structure, 3Q12-4Q12
Chart 19: New form factor notebook shipments and share of overall notebook market, 2012 (k units)
Chart 20: Top-10 notebook brands' shipments in each quarter of 2012 (k units)
Chart 21: Top-10 notebook brands' market share in each quarter of 2012
Chart 22: Top-10 notebook brand quarterly shipment growth, 2012
Chart 23: Top-10 notebook brands quartely on-year shipment growth, 2012
Chart 25: Ultrabooks quarterly proportion of notebook shipments, by brand, 2012
Chart 26: SSD-based notebook shipments by brand, 4Q11-4Q12 (k units)
Chart 27: SSD-based notebook share of notebook shipments, by vendor, 4Q11-4Q12
Table 1: Windows 8-based transformable notebook and tablet plans, by vendor, 2012
Chart 28: Notebook brands' transformable notebook shipment forecast (k units)
Chart 29: Transformable notebook share of notebook shipments, by vendor 2H12
Chart 30: Touchscreen notebook shipment forecast, by vendor, 2H12 (k units)
Chart 31: Touchscreen notebook share of total notebook shipments by vendor, 2H12
Chart 34: Top-10 notebook brands' on-year shipment growth in 2012
Table 2: Notebook vendor outsourcing volumes by ODM, 2012 (k units)
Chart 37: Taiwan quarterly notebook shipments and share, 4Q11-4Q12 (k units)
Chart 38: Samsung notebook order volumes to Taiwan ODMs, 2Q12-4Q12 (k units)

